Veja também

 22.09.2025 07:39 AM
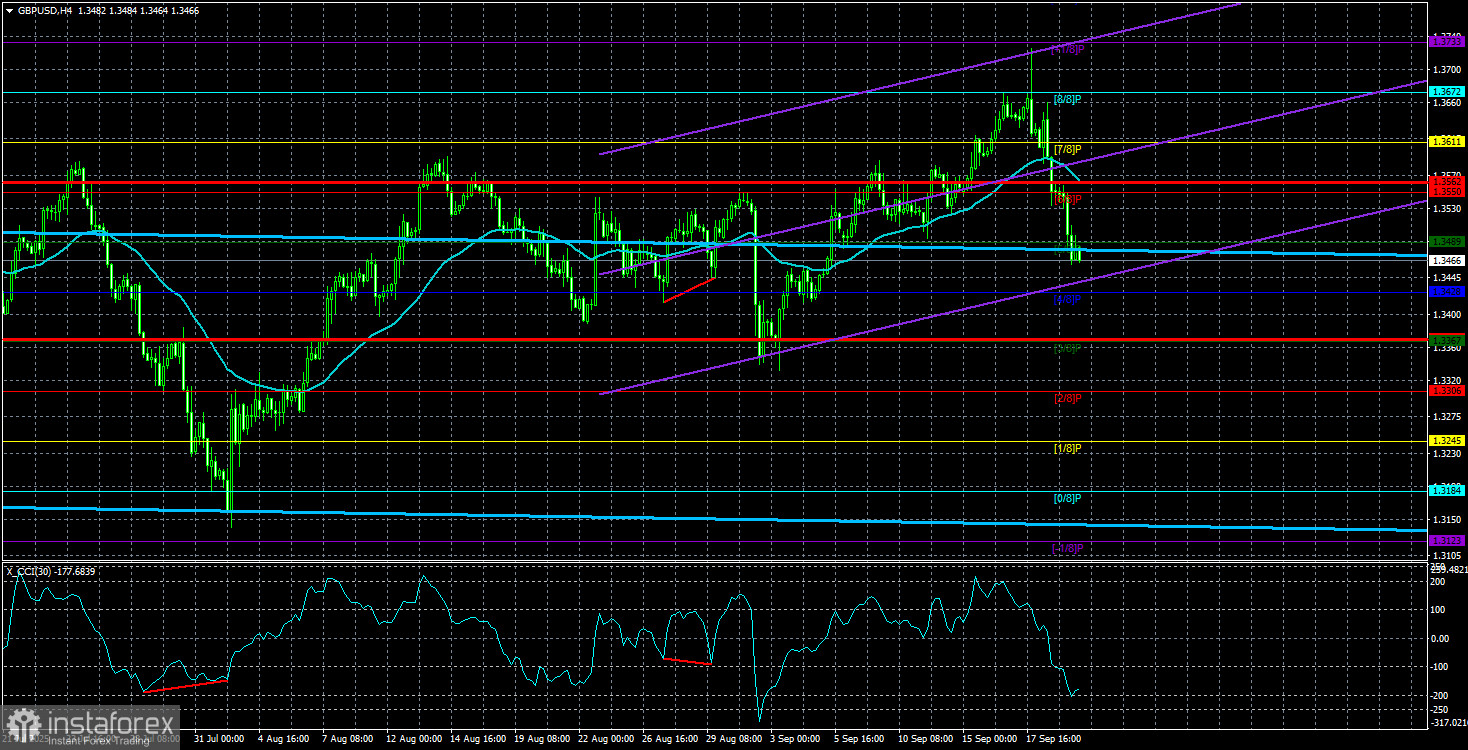
The GBP/USD currency pair continued its downward trend on Friday, and it was much more pronounced than what we saw with the EUR/USD pair. This allows us to immediately conclude that it was the British pound that started the decline first — and it had specific reasons for doing so. The euro simply followed.
Why did the British pound fall? The meetings of the Federal Reserve and the Bank of England had absolutely nothing to do with it, as the British central bank decided to maintain its monetary policy parameters, did not signal any upcoming rate cuts, and only slightly trimmed its quantitative easing (QE) program. Meanwhile, the Fed lowered its key rate and hinted at the possibility of two more rate cuts by the end of the year. Consequently, the results of these two meetings should have been interpreted in favor of the British currency.
Nevertheless, the pound began falling on Wednesday evening. That initial drop can be explained by the market preemptively reacting to the expected Fed rate cut and then engaging in profit-taking. But other factors later came into play—namely, one primary factor.
Recall that over the past few months, the UK government has been working on its financial plan for 2026. The draft budget is running a deficit, which implies another increase in national debt. At the same time, the yield on British bonds is steadily rising, making government borrowing more expensive. This further deepens the budget deficit. A few months ago, Rachel Reeves came under heavy criticism in Parliament and even broke into tears during a session, which immediately triggered a sharp decline in the pound. A few weeks later, UK bond yields rose to their highest levels since 1998, sparking another sell-off of the pound. Last Thursday, it was reported that British national debt grew at a record pace in August, and that in order to reduce the budget deficit in 2026, taxes would need to be raised. This news triggered the third pound crash.
We've said before that the British pound had little to no merit in its 2025 rally. The dollar was falling, and the pound was simply reaping the benefits. Were it not for the financial issues in the UK, the pound would be worth significantly more right now. But Britain is sabotaging its own currency, thereby holding back its growth.
It's important to note that many economically and technologically developed countries don't benefit from a strong national currency. The more expensive the currency, the lower the export volumes. So it's hard to argue that a strong pound is really beneficial for Britain. Even with the pound steadily weakening over the last 17 years, the UK economy continues to struggle post-Brexit — and that's already been 9 years. While the economy does occasionally show growth, overall it resembles stagnation more than anything.
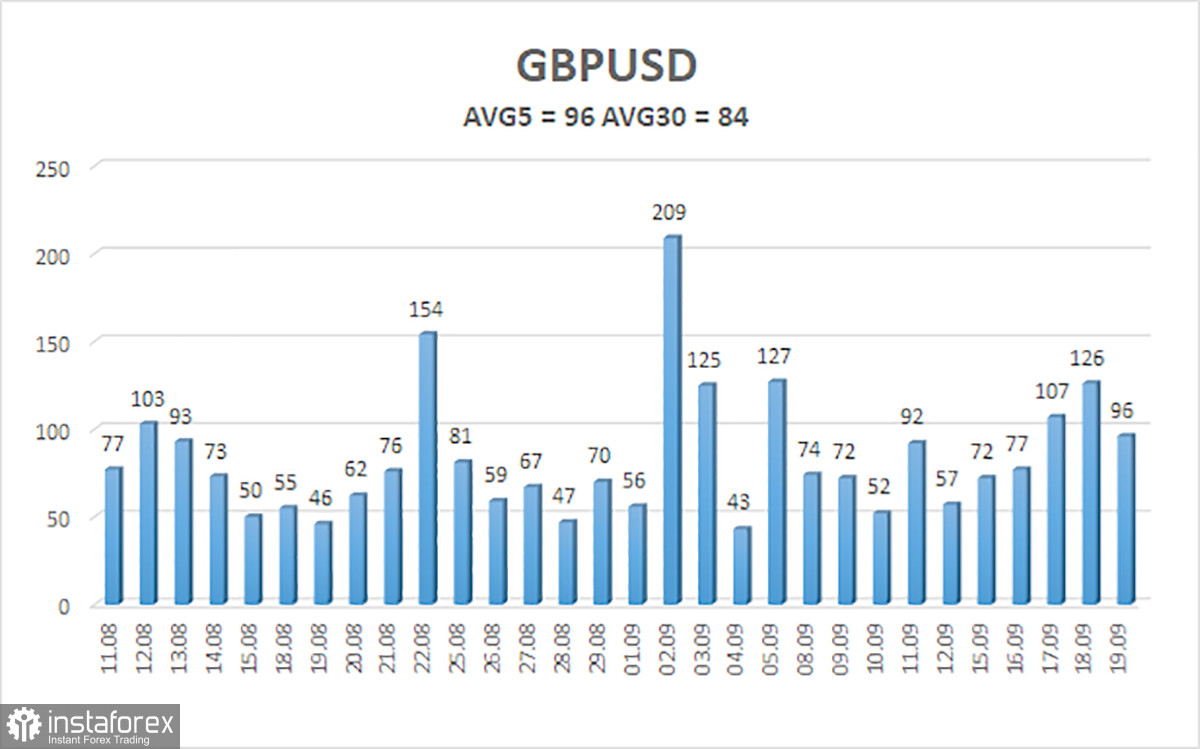
Average volatility for the GBP/USD pair over the last five trading days is 96 points, which is considered "average" for this pair. On Monday, September 22, we expect the pair to move within the range defined by the 1.3370 and 1.3562 levels. The senior linear regression channel is trending upward, indicating a clear uptrend. The CCI indicator once again entered oversold territory, which served as another warning of a likely resumption of the uptrend.
Nearest support levels:
Nearest resistance levels:
Trade Recommendations:
The GBP/USD currency pair is undergoing another correction, but its long-term outlook hasn't changed. Donald Trump's policies will likely continue putting pressure on the dollar, so we do not expect any major rally from the U.S. currency. Thus, long positions with targets at 1.3672 and 1.3733 remain more relevant as long as the price remains above the moving average. If the price is below the MA, minor short positions can be considered on purely technical grounds. From time to time, the U.S. dollar does show brief corrections (as it is doing now), but for a sustained upward trend, it needs fundamental indicators such as the clear conclusion of the global trade war or other major positive developments.
Explanation of chart elements:


