
Veja também


 15.07.2026 09:43 AM
Investors cheered an unexpectedly soft June inflation print so enthusiastically that they largely ignored a historic collapse in one of tech's icons. The S&P 500, Dow Jones, and Nasdaq Composite closed the session in the green even as IBM plunged by about 25%, marking the worst one-day drop in the company's history.
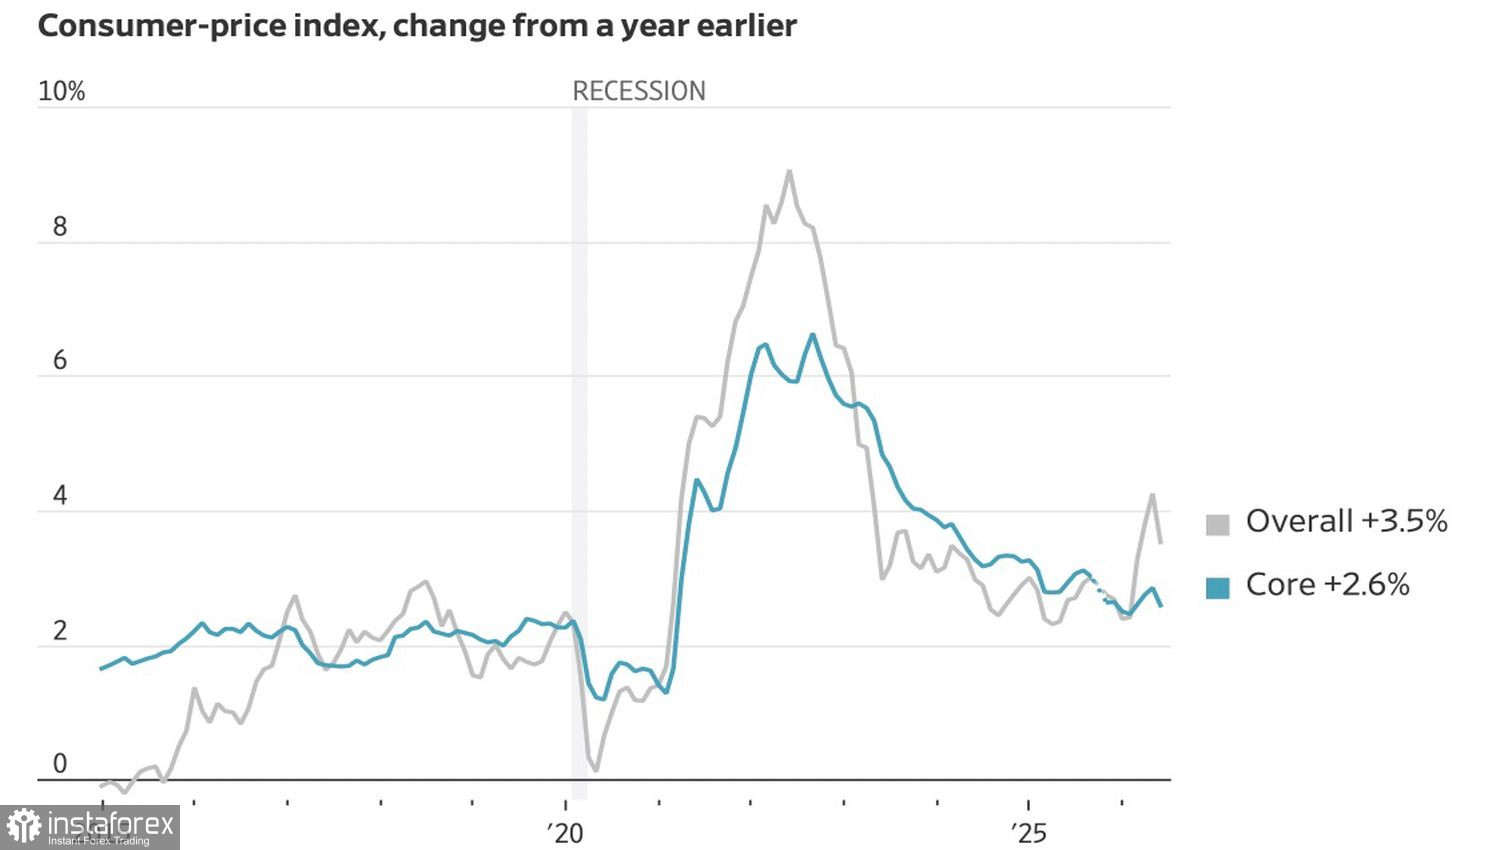
Headline CPI rose by 3.5% y/y in June versus the 3.8% expected. Core inflation was essentially unchanged, and the monthly CPI fell for the first time in six years. Futures reacted immediately: the odds of a Fed hike at the next meeting plunged from 42% to 17%.
US inflation dynamics
Yet it is too early to declare victory over inflation. Fed Chair Kevin Warsh told Congress that a single good month does not end the inflation mission. Military activity in the Persian Gulf continues to pose upside risks to energy prices, meaning that the tightening narrative is far from closed. Warsh deliberately refrained from committing to a policy path until further data arrives, preserving optionality for the Fed.
The market's resilience is not resting on inflation alone. The five largest US banks reported a combined 39% jump in quarterly profits, helped by trading revenues and deals such as the SpaceX IPO. Goldman Sachs, JPMorgan, and Bank of America rallied on results, while Wells Fargo and Citigroup lagged.
IBM's collapse, however, is not a routine blip. The company warned of weakness in software and infrastructure and admitted it failed to adapt quickly enough to shifting market conditions. The sell-off erased about $69bn of market cap and dragged down shares such as Accenture and ServiceNow. The question now is whether this is an early warning for the corporate-software space in the AI era.
Fund managers already see reason for caution even without IBM. A Bank of America fund-manager survey shows cash levels in portfolios have fallen to a super-low 3.6% of assets, while US equity overweight hits a peak last seen in December 2024. BofA's Bull & Bear indicator registers extreme bullishness, which is a historically contrarian signal. Eighty-two percent of respondents name chip-maker long positions the most crowded trade, and almost half see losses at AI hyperscalers as the leading black-swan candidate.
How solid is this calm?
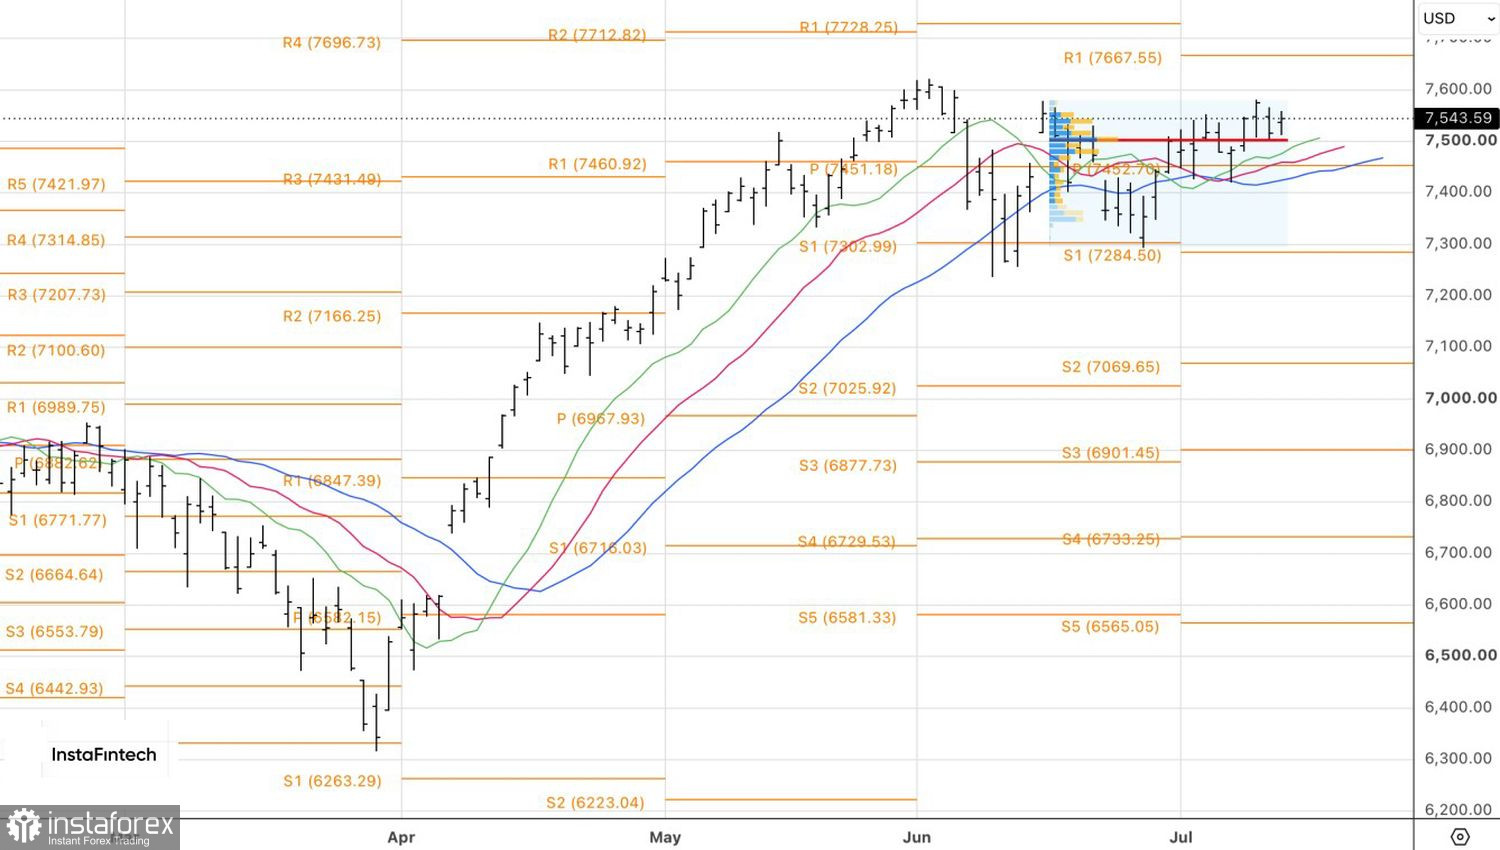
Technically, the daily chart shows that the S&P 500 has formed an inside bar. A break above its high at 7,565 would be a signal to add long positions. Conversely, a drop below the low at 7,515 would be a cue to initiate short positions.
You have already liked this post today
*A análise de mercado aqui postada destina-se a aumentar o seu conhecimento, mas não dar instruções para fazer uma negociação.


