Padrões atuais

Padrões são modelos gráficos que são formados no gráfico pelo preço. Segundo um dos postulados da análise técnica, a história (movimento de preços) se repete. Isso significa que os movimentos de preços geralmente são semelhantes nas mesmas situações, o que possibilita prever o desenvolvimento futuro da situação com alta probabilidade.
Os padrões relevantes da InstaTrade são um serviço fácil de usar, que permite que você esteja ciente das últimas mudanças no mercado e reaja a indícios do mercado a tempo. Em nosso serviço, você sempre encontrará os padrões mais recentes e relevantes em qualquer par e em qualquer período gráfico.
Double Top
was formed on 20.06 at 16:00:11 (UTC+0)
signal strength 3 of 5
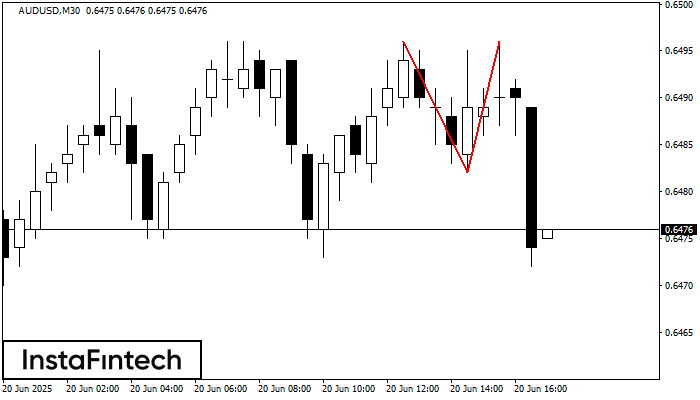
On the chart of AUDUSD M30 the Double Top reversal pattern has been formed. Characteristics: the upper boundary 0.6496; the lower boundary 0.6482; the width of the pattern 14 points. The signal: a break of the lower boundary will cause continuation of the downward trend targeting the 0.6452 level.
- All
- All
- Bearish Rectangle
- Bearish Symmetrical Triangle
- Bearish Symmetrical Triangle
- Bullish Rectangle
- Double Top
- Double Top
- Triple Bottom
- Triple Bottom
- Triple Top
- Triple Top
- All
- All
- Buy
- Sale
- All
- 1
- 2
- 3
- 4
- 5
Triângulo Simétrico de Alta
was formed on 05.08 at 22:29:08 (UTC+0)
signal strength 2 of 5
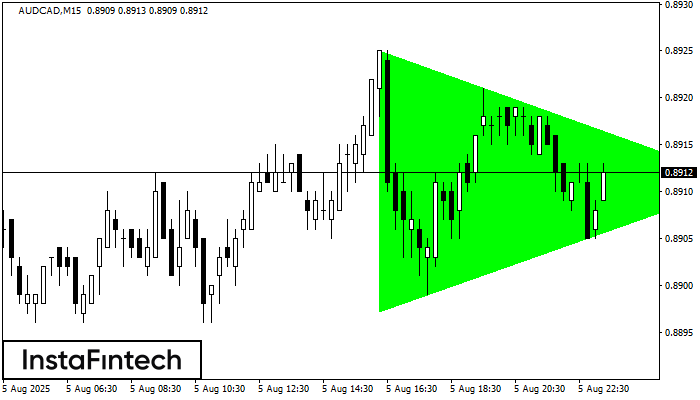
De acordo com o gráfico de M15, AUDCAD formaram o padrão de Triângulo Simétrico de Alta. Descrição: Este é o padrão de uma continuação de tendência. 0.8925 e 0.8897
Os intervalos M5 e M15 podem ter mais pontos de entrada falsos.
Open chart in a new window
Fundo duplo
was formed on 05.08 at 21:55:16 (UTC+0)
signal strength 1 of 5
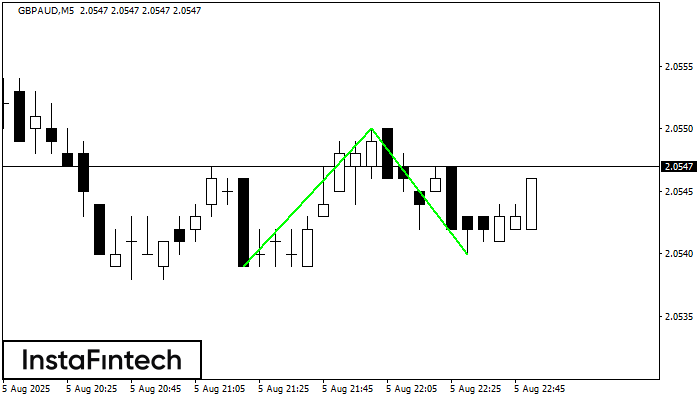
O padrão Fundo duplo foi formado em GBPAUD M5. Esta formação sinaliza uma reversão da tendência de baixo para cima. O sinal é que uma negociação de compra deve
Os intervalos M5 e M15 podem ter mais pontos de entrada falsos.
Open chart in a new window
Topo triplo
was formed on 05.08 at 20:45:42 (UTC+0)
signal strength 1 of 5
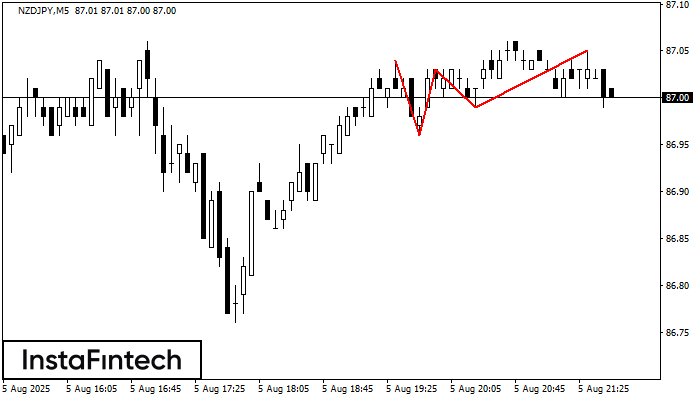
O padrão Topo triplo se formou no gráfico de NZDJPY M5. Características do padrão: os limites têm um ângulo ascendente; a linha inferior do padrão tem as coordenadas 86.96/86.99
Os intervalos M5 e M15 podem ter mais pontos de entrada falsos.
Open chart in a new window