Padrões atuais

Padrões são modelos gráficos que são formados no gráfico pelo preço. Segundo um dos postulados da análise técnica, a história (movimento de preços) se repete. Isso significa que os movimentos de preços geralmente são semelhantes nas mesmas situações, o que possibilita prever o desenvolvimento futuro da situação com alta probabilidade.
Os padrões relevantes da InstaTrade são um serviço fácil de usar, que permite que você esteja ciente das últimas mudanças no mercado e reaja a indícios do mercado a tempo. Em nosso serviço, você sempre encontrará os padrões mais recentes e relevantes em qualquer par e em qualquer período gráfico.
Bearish Rectangle
was formed on 20.06 at 17:03:59 (UTC+0)
signal strength 4 of 5
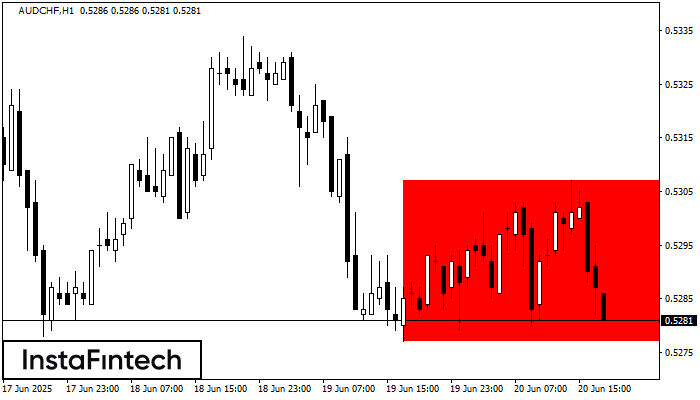
According to the chart of H1, AUDCHF formed the Bearish Rectangle. The pattern indicates a trend continuation. The upper border is 0.5307, the lower border is 0.5277. The signal means that a short position should be opened after fixing a price below the lower border 0.5277 of the Bearish Rectangle.
- All
- All
- Bearish Rectangle
- Bearish Symmetrical Triangle
- Bearish Symmetrical Triangle
- Bullish Rectangle
- Double Top
- Double Top
- Triple Bottom
- Triple Bottom
- Triple Top
- Triple Top
- All
- All
- Buy
- Sale
- All
- 1
- 2
- 3
- 4
- 5
Topo duplo
was formed on 13.08 at 05:10:23 (UTC+0)
signal strength 1 of 5
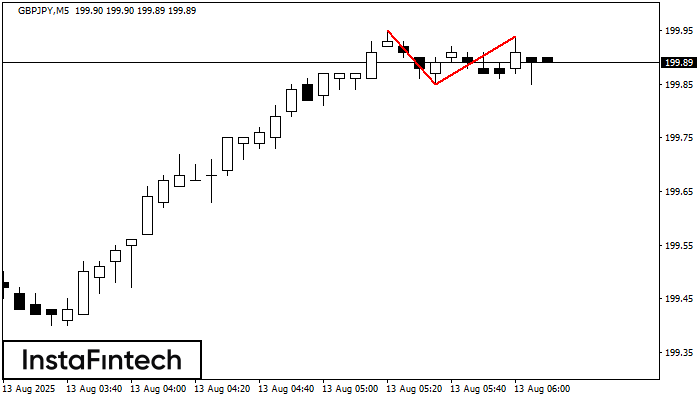
No gráfico de GBPJPY M5 o padrão de reversão Topo duplo foi formado. Características: o limite superior 199.94; o limite inferior 199.85; a largura do padrão 9 pontos. O sinal
Os intervalos M5 e M15 podem ter mais pontos de entrada falsos.
Open chart in a new window
Retângulo de alta
was formed on 13.08 at 04:21:48 (UTC+0)
signal strength 1 of 5
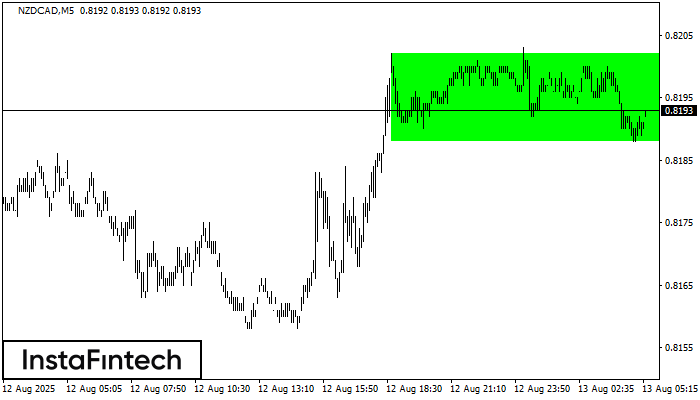
De acordo com o gráfico de M5, NZDCAD formou o Retângulo de alta que é um padrão de uma continuação da tendência. O padrão está dentro dos seguintes limites
Os intervalos M5 e M15 podem ter mais pontos de entrada falsos.
Open chart in a new window
Cabeça & Ombros
was formed on 13.08 at 04:06:13 (UTC+0)
signal strength 1 of 5
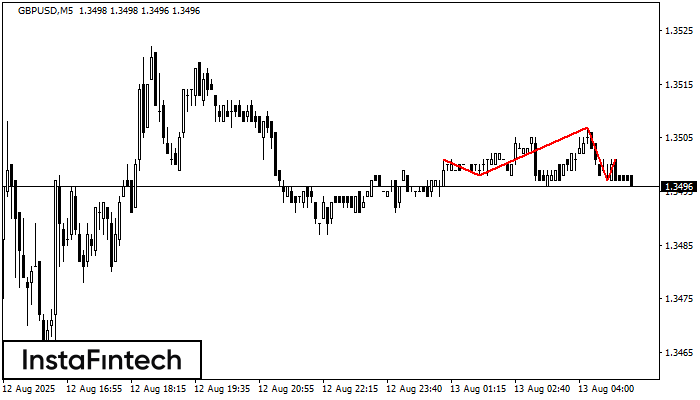
Os GBPUSD M5 formaram o padrão Cabeça & Ombros com as seguintes características: O topo da cabeça está em 1.3507, a linha do pescoço e o ângulo para cima estão
Os intervalos M5 e M15 podem ter mais pontos de entrada falsos.
Open chart in a new window