Vea también

 15.05.2025 01:31 AM
Brent is struggling to stay afloat, even as looming strikes on Iran and new turns in U.S. sanctions diplomacy come into view. Meanwhile, natural gas is currently in a bind due to decreasing demand and the unpredictable nature of a technical correction. Let's break down the forces behind this fragile balance and where the price pendulum might swing next.
The oil market now resembles a chess match played on three boards: politics, demand, and inventories.
In this atmosphere of realpolitik, Donald Trump is re-emerging as a pricing factor. According to a Goldman Sachs study that analyzed over 900 of his tweets, Trump's "comfort zone" for oil prices is $40–50 per barrel.
In other words, with Brent currently at $65–66, Washington is likely to engage in direct and indirect efforts to bring prices down, especially ahead of a presidential visit to Qatar and the UAE, where "price stability" is an unspoken prerequisite for energy partnerships.
That said, Brent is holding at two-week highs for a reason:
These positive factors offset the bearish surprise from the latest API data, which showed a +4.29 million barrel increase in U.S. crude stocks (versus expectations of a 2.4 million barrel decline). The next key data point is the official EIA report.
Brent is clinging to key resistance at the $66.00–66.50 zone and still targets a breakout toward $68.50, a former sell-off area. Immediate support lies at $65.60.
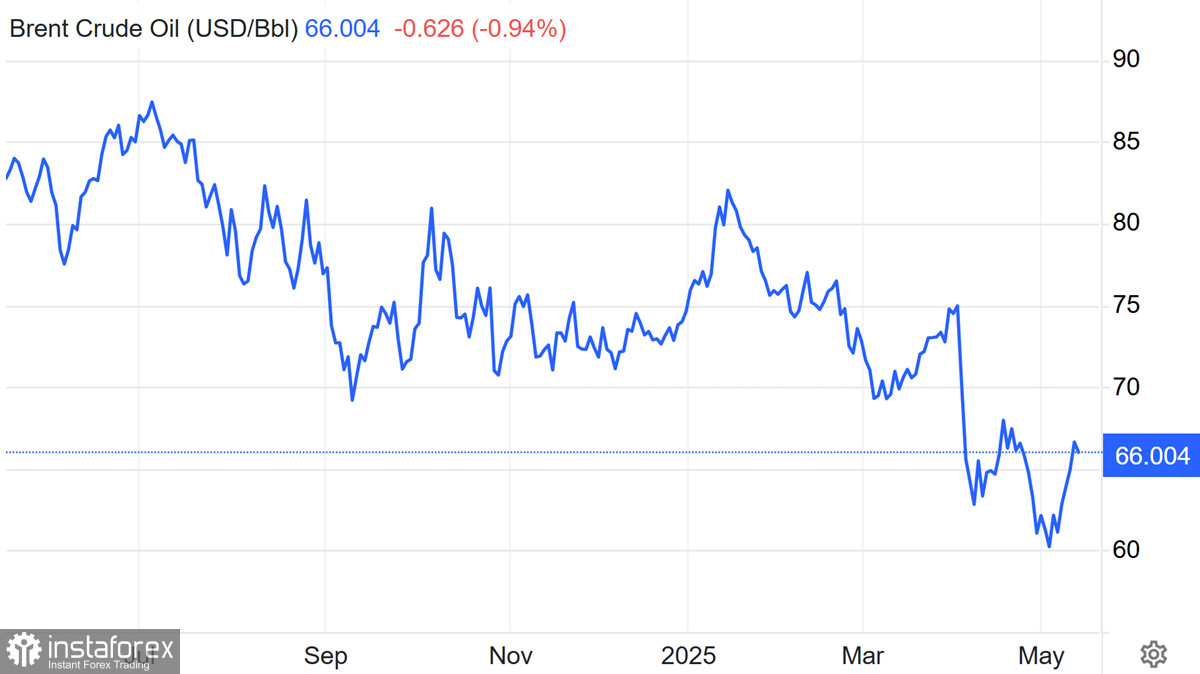
Below is the $64.20 level—April's launchpad for the previous upward impulse. If EIA data disappoints, we could see a break below $65.60 and a downward correction.
But for now, the market structure suggests potential for further upward movement, mainly due to a "geopolitical premium."
Due to scheduled maintenance at LNG export facilities, natural gas slipped below $3.60/MMBtu amid softening demand. Cameron LNG, Cheniere, and Freeport have temporarily throttled output, reducing average U.S. LNG exports to 15.1 billion cubic feet/day, down from the April peak of 16.0 bcf/d.
This sharp drop in short-term demand hasn't changed the fundamental story—the U.S. remains the global LNG leader, and summer electricity demand is just around the corner.
Technically, gas is trapped in a triangle between descending resistance and horizontal support at $3.566. The upper boundary lies at $3.726. A breakout from this pattern will define the next major move.
Currently, a bearish bias prevails in the short term; however, if the bulls gain momentum, a significant rally towards $3.85 or higher could occur.
Both oil and gas are at the crossroads of geopolitics and supply-demand data. The key is to follow the trend and stay alert to headlines, especially when that direction is influenced by a man with golden tweets and a strategy that states, "Brent at $45—no surprises."


