Vea también

 07.07.2025 07:32 AM
Friday Trade Analysis:
EUR/USD 1H Chart
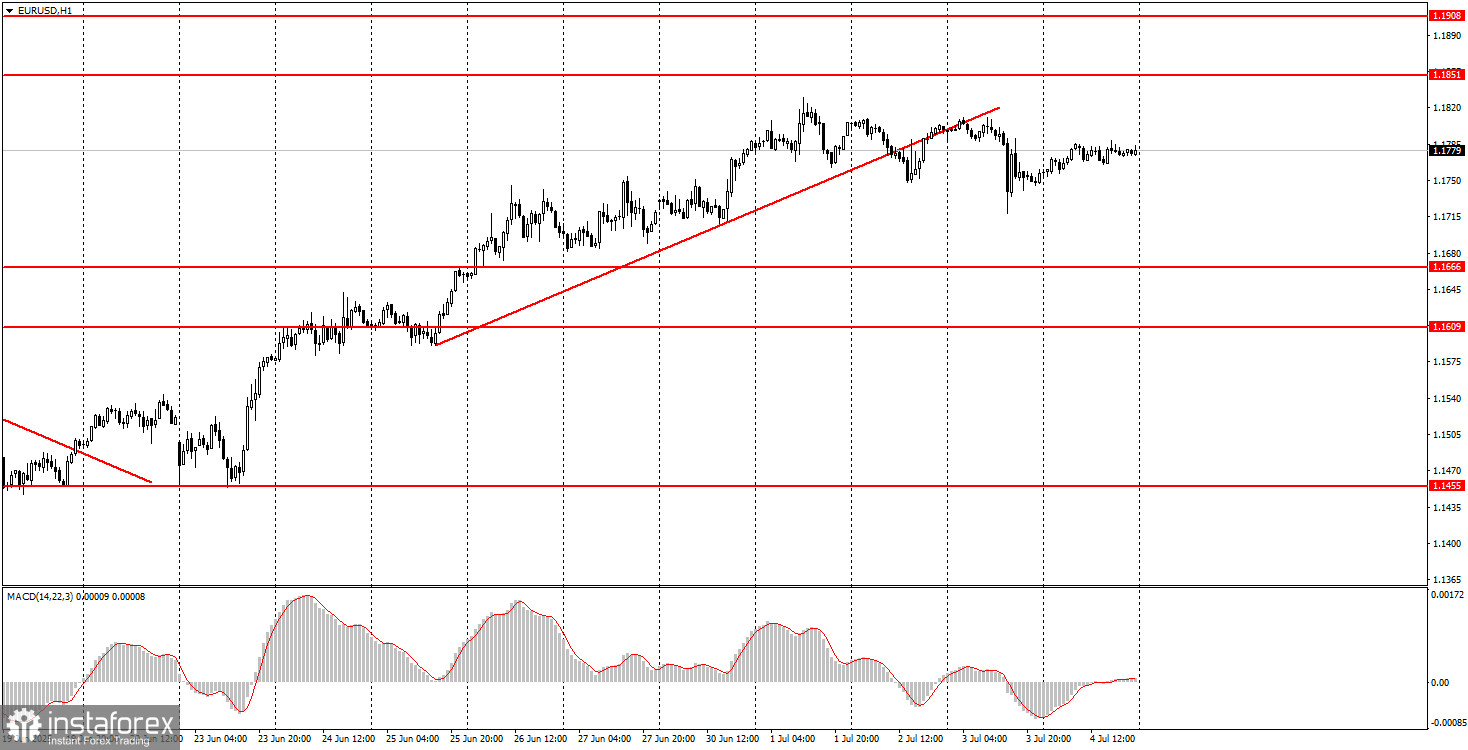
The EUR/USD pair stayed flat all day Friday, with volatility totaling 36 points, clearly indicating a lack of trading activity. This is not surprising, as the U.S. was celebrating Independence Day, and all banks and stock exchanges were closed. Naturally, there were no important publications or events on this day. The only event was another speech by Christine Lagarde—her sixth in the past two weeks. However, the pair's lack of movement shows that Ms. Lagarde didn't announce anything significant this time either.
EUR/USD 5M Chart
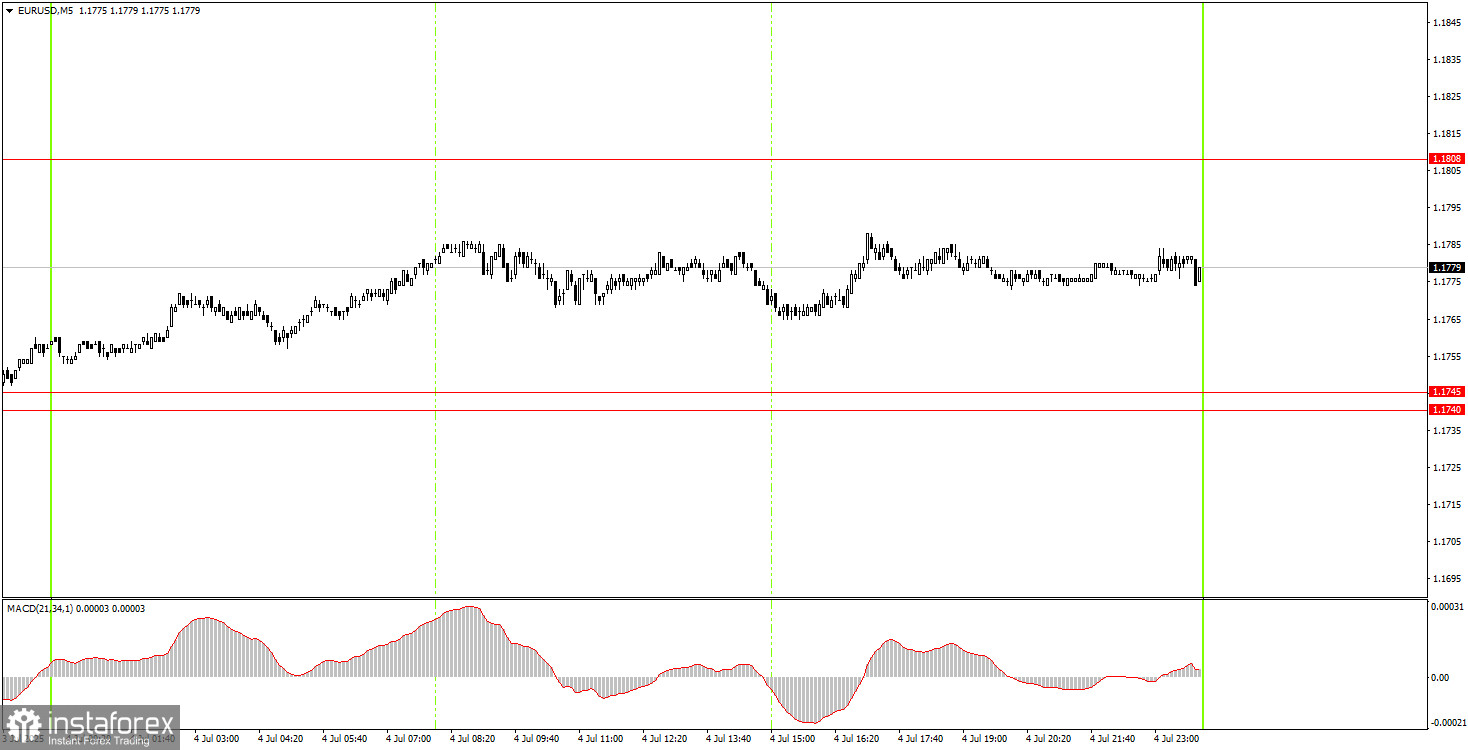
On the 5-minute timeframe, not a single trading signal was formed on Friday—again, not surprising given the market's inactivity. Thus, there were no valid grounds for opening any positions.
How to Trade on Monday:
On the hourly timeframe, the EUR/USD pair continues its uptrend, despite having broken the upward trendline. The fact that Donald Trump is President of the United States remains sufficient for the U.S. dollar to continue weakening regularly. Of course, the dollar will undergo periodic corrections, but given the broader fundamental backdrop, any strong upward move remains unlikely. The pair may remain range-bound for a few more days, followed by another dollar sell-off. Last week, there was macroeconomic support for the dollar—but it failed to provide any tangible help.
On Monday, EUR/USD may continue to move sideways or trade with low volatility. No major events are scheduled for the first trading day of the week.
On the 5-minute timeframe, pay attention to the following levels: 1.1198–1.1218, 1.1267–1.1292, 1.1354–1.1363, 1.1413, 1.1455–1.1474, 1.1527, 1.1561–1.1571, 1.1609, 1.1666, 1.1740–1.1745, 1.1808, 1.1851, 1.1908.
On Monday, only two reports are expected: industrial production in Germany and retail sales in the eurozone. However, such data in 2025 generally fails to spark market interest. These publications are not expected to provide meaningful support to the U.S. dollar.
Key Rules of the Trading System:
What's on the chart:
Beginner Tip:
Not every trade can be profitable. A clearly defined strategy and proper money management are essential for long-term success in Forex trading.


