Vea también

 17.07.2025 03:21 AM
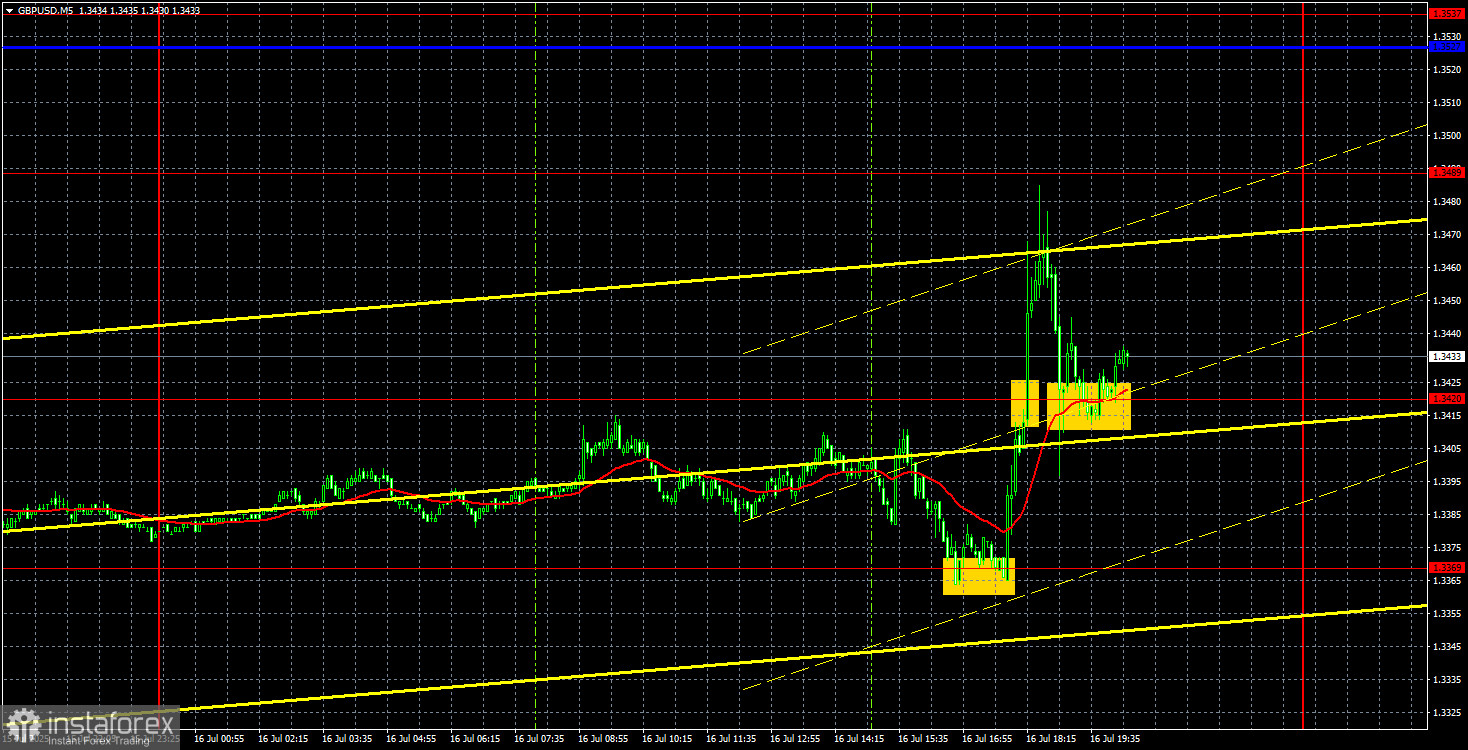
On Wednesday, the GBP/USD currency pair continued to decline throughout most of the day, until an inexplicable surge in the evening. Recall that on Tuesday, the U.S. inflation report was published, and its figure matched market forecasts exactly. Therefore, there was nothing for the market to react to. However, traders who were already set on a correction used the report as a formal excuse to sell the British pound.
A similar situation occurred yesterday. In the morning, the UK released its inflation report, and the British figure increased in a similar manner to the American one. The only difference was that traders had not expected the UK consumer price index to accelerate to 3.6%. Since they hadn't anticipated it, they hadn't priced it in beforehand. Because inflation rose, this was a bullish factor for the British pound. It also implies that the Bank of England will not be in a hurry to cut the key rate again. However, unlike Tuesday, the market did not feel compelled to buy the pound in response to the inflation report. This is because traders are now focused on a correction and are taking profits from long positions they had opened earlier this year.
Thus, we still believe the current downward move is a technical correction. Yes, it is beginning to look quite substantial, but on the daily timeframe, it's not particularly dramatic. The pound has fallen 400 pips in recent weeks, but it had previously gained 1700 over the last five months. The bullish trend of 2025 is not over.
On the 5-minute timeframe, the price only reached the first key level and formed the first signal by the evening. It wasn't until late in the day that it reached the 1.3369 level, with overall volatility staying low throughout the day. In the evening, we saw a strong upward move, but it was impossible to predict. Still, a buy signal did form.
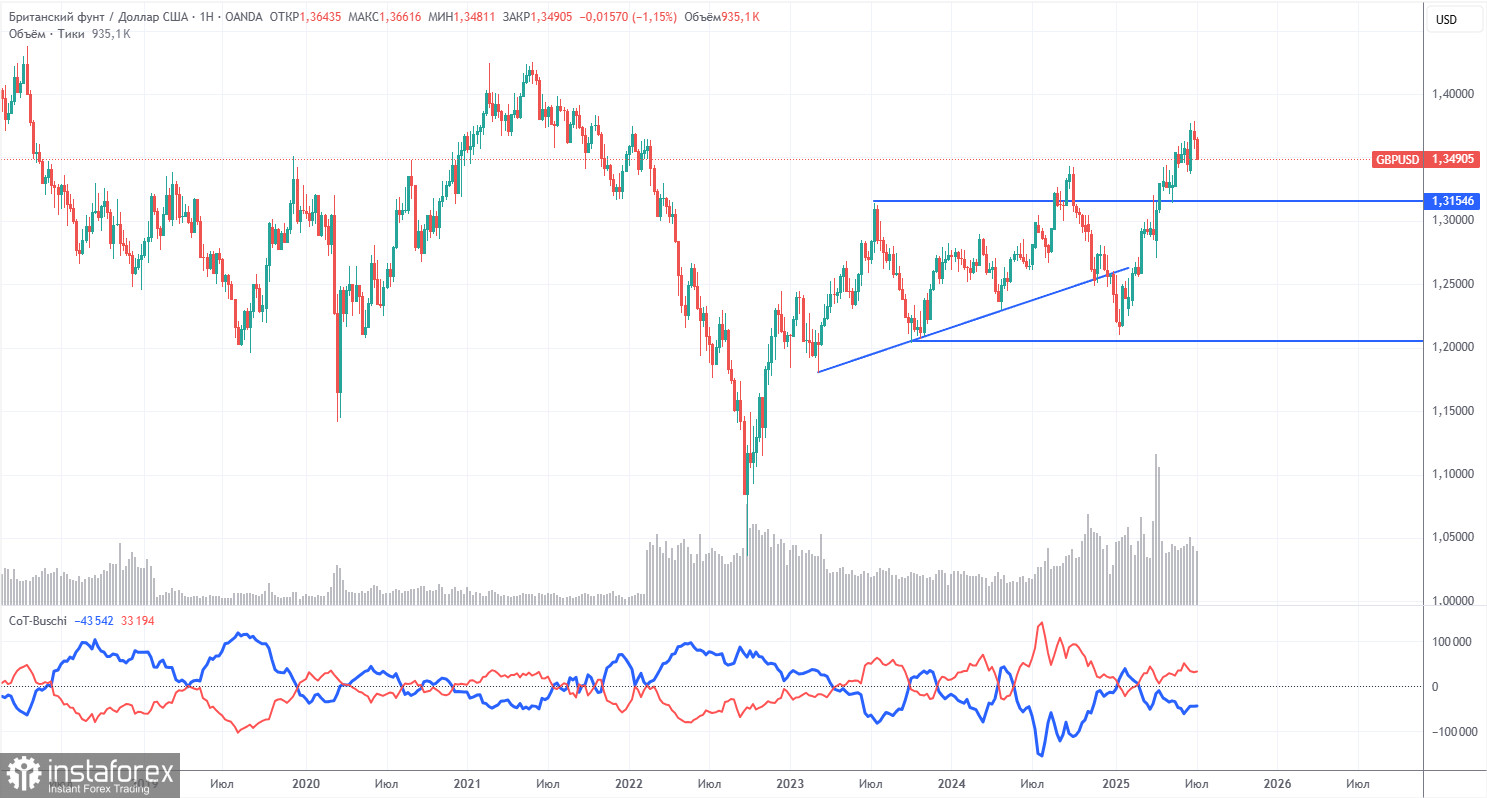
COT reports for the British pound show that in recent years, commercial traders' sentiment has changed constantly. The red and blue lines, representing the net positions of commercial and non-commercial traders, frequently cross and usually stay close to the zero line. Currently, they are also close to each other, indicating a roughly equal number of buy and sell positions. However, over the past 18 months, the net position has been growing and in recent months has been "bullish."
The dollar continues to decline due to Donald Trump's policies, so for now, the demand from market makers for the British pound is not particularly important. The trade war will continue in some form for a long time. Demand for the dollar will decline in one way or another. According to the latest report on the British pound, the "Non-commercial" group opened 800 BUY contracts and closed 900 SELL contracts. Thus, the net position of non-commercial traders increased by 1,700 contracts over the reporting week, which is practically insignificant.
The pound rose significantly in 2025, but it should be understood that the reason was Trump's policies. Once that factor is neutralized, the dollar could start to strengthen—but no one knows when that will happen. The dollar is only at the beginning of a challenging period. There are still 3.5 years left of Trump's administration.
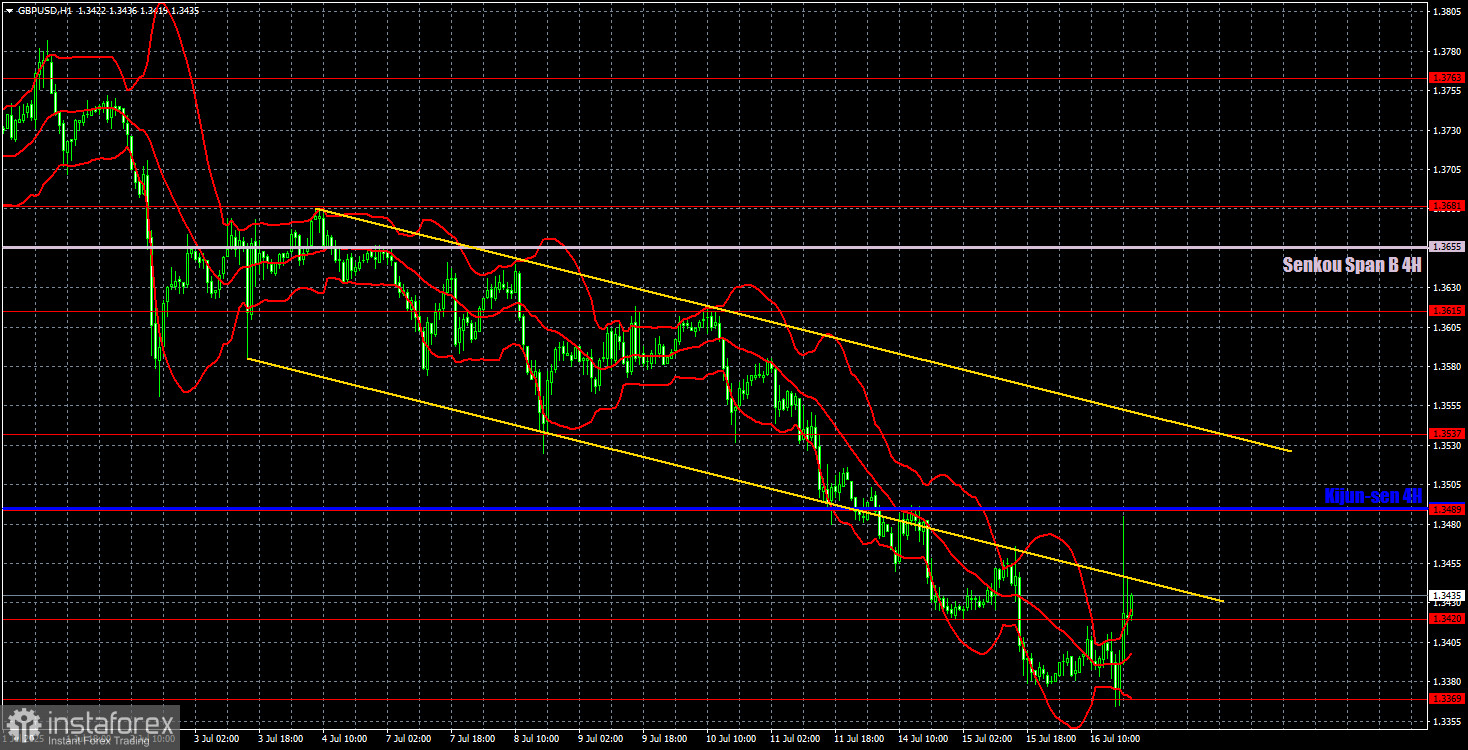
On the hourly timeframe, the GBP/USD pair continues to move downward, as confirmed by the descending channel. The market largely ignored Trump's new tariffs last week and continues to do so this week. We believe these new tariffs will be priced in once the current technical correction is over. Therefore, for now, trading short positions on technical grounds is reasonable; however, keep in mind that there are still no medium-term fundamentals favoring dollar strength.
For July 17, we highlight the following key levels: 1.3125, 1.3212, 1.3369, 1.3420, 1.3489, 1.3537, 1.3615, 1.3741–1.3763, 1.3833, 1.3886. The Senkou Span B line (1.3655) and Kijun-sen line (1.3490) may also act as signal points. A Stop Loss should be set to breakeven once the price moves 20 pips in the correct direction. The Ichimoku indicator lines may shift throughout the day, so this should be taken into account when identifying trading signals.
On Thursday, the UK will release several important reports, but we do not doubt that the market will likely ignore them, even if they are positive. The UK will publish unemployment figures, wage data, and jobless claims. In the U.S., the only notable release is the retail sales report.


