Vea también

 17.07.2025 03:21 AM
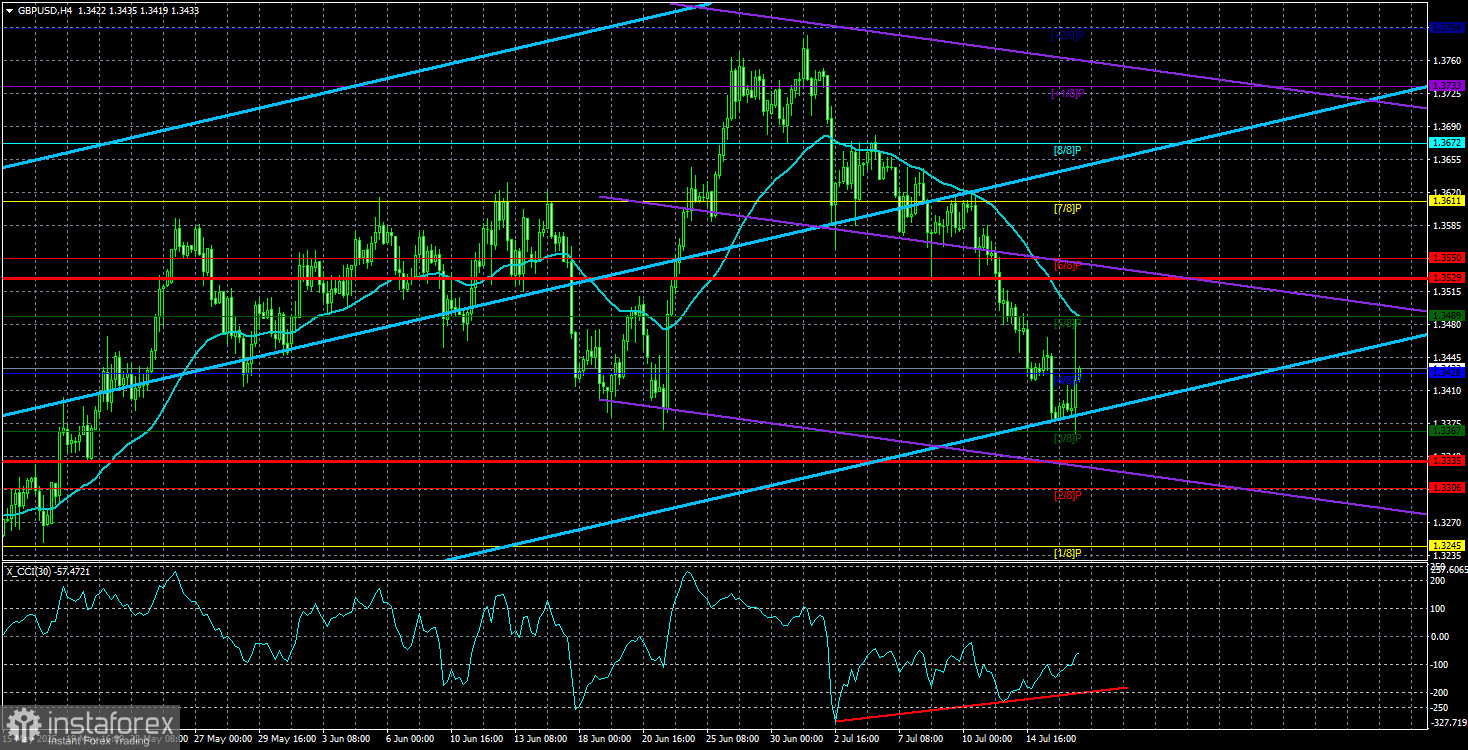
The GBP/USD currency pair also traded more calmly on Wednesday compared to Tuesday, although a surge occurred in the evening. Let us recall that we do not consider Tuesday's decline to be justified, as the U.S. inflation report had no theoretical chance of altering the Federal Reserve's stance on the key interest rate. Regardless of how inflation behaves in the near term, Jerome Powell and his colleagues will wait at least until autumn to draw initial conclusions about the impact of Trump's tariffs on the economy. However, from a formal perspective, rising U.S. inflation means that the likelihood of imminent monetary policy easing is approaching zero. While the market previously ignored this factor, focusing solely on the trade war, it has now unexpectedly started reacting to dollar-positive news.
We believe the current drop in GBP/USD is merely a technical correction, and the market is simply using favorable factors as an excuse to sell. In reality, the trade war is far from over and is intensifying month by month. One might argue that this no longer concerns the British pound since the UK was the first to sign a trade deal with Trump. However, on Wednesday morning, an inflation report was published in the UK, offering some important insights.
Inflation in the UK jumped after a one-month pause to 3.6% year-over-year. Core inflation rose to 3.7%. UK inflation has been rising for nearly a year—last September it stood at just 1.7%. Thus, inflation has more than doubled in less than a year. The Consumer Price Index now exceeds the Bank of England's target by nearly twofold.
What does this imply?
First, we certainly won't see another rate cut from the Bank of England anytime soon. Second, UK inflation could serve as an indicator of whether Trump's tariffs will trigger merely a short-term inflationary shock, as expected in the U.S. Since the UK will not face any further tariff hikes, inflation should start to decline over time. If it doesn't, a similar scenario is likely to unfold in the U.S.
This understanding leads to the conclusion that Trump's tariffs may prove to be far more destructive than many experts currently believe. As for the GBP/USD outlook, we still see no fundamental reason for the dollar to strengthen in the medium term. Naturally, the dollar will not fall forever, but the market is unlikely to have fully priced in all of Trump's tariffs, especially considering that many more may lie ahead rather than behind us. Let's not forget that none of the U.S.'s trade partners are rushing to accept the president's terms or comply with his constantly shifting deadlines. Only two weeks remain until August 1, and they will pass quickly.
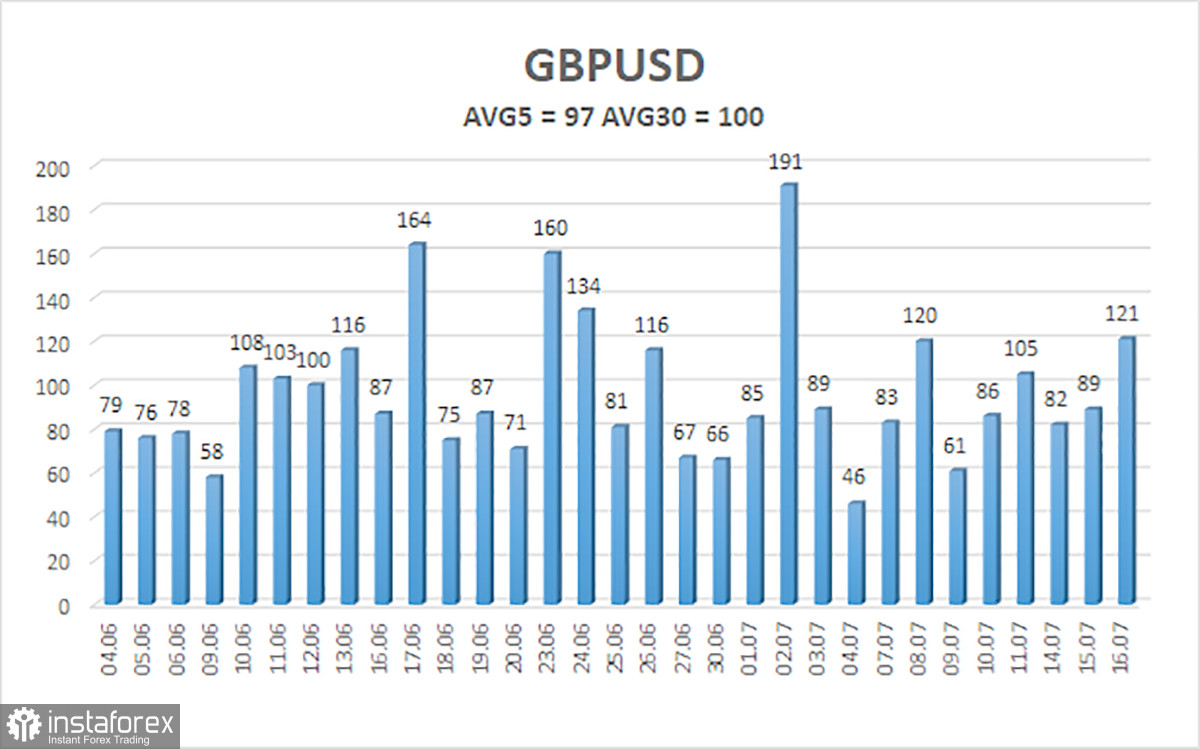
The average volatility of the GBP/USD pair over the last five trading days is 97 pips, which is considered "moderate" for the pair. Thus, on Thursday, July 17, we expect movement within the range of 1.3335 to 1.3529. The long-term regression channel is directed upward, indicating a clear uptrend. The CCI indicator has twice entered the oversold zone, now signaling a potential resumption of the upward trend. Bullish divergences are also forming.
S1 – 1.3367
S2 – 1.3306
S3 – 1.3245
R1 – 1.3428
R2 – 1.3489
R3 – 1.3550
The GBP/USD currency pair continues its downward correction, which may soon come to an end. The pair has corrected sufficiently, and in the medium term, Donald Trump's policies are likely to continue putting pressure on the U.S. dollar. As such, long positions with targets at 1.3611 and 1.3672 remain valid if the price consolidates above the moving average. If the price remains below the moving average line, short positions with targets at 1.3367 and 1.3335 can be considered, based purely on technical grounds.
From time to time, the U.S. dollar exhibits corrective strength, but for an actual trend reversal, the market would need clear signs that the global trade war is coming to an end.
Linear Regression Channels help determine the current trend. If both channels are aligned, it indicates a strong trend.
Moving Average Line (settings: 20,0, smoothed) defines the short-term trend and guides the trading direction.
Murray Levels act as target levels for movements and corrections.
Volatility Levels (red lines) represent the likely price range for the pair over the next 24 hours based on current volatility readings.
CCI Indicator: If it enters the oversold region (below -250) or overbought region (above +250), it signals an impending trend reversal in the opposite direction.


