Vea también

 03.09.2025 06:50 AM
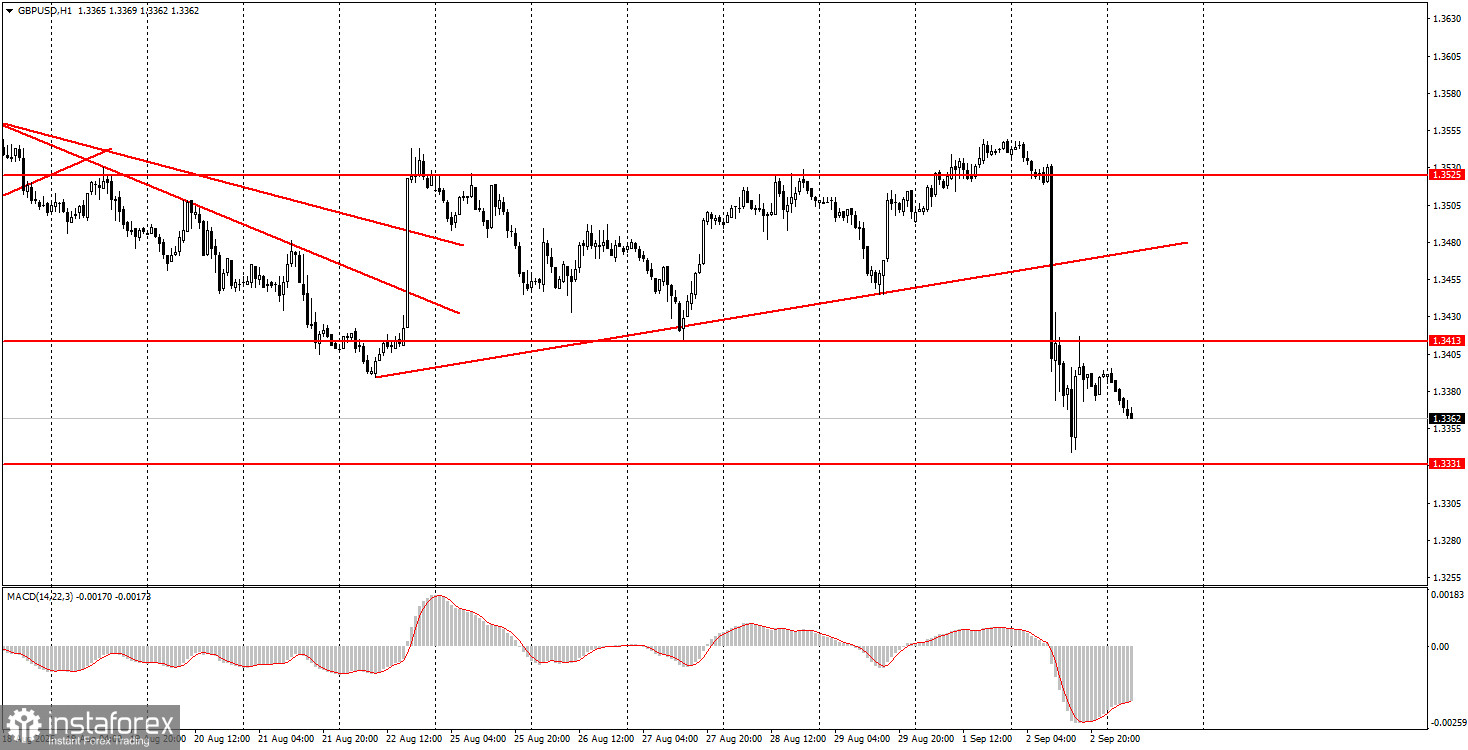
On Tuesday, the GBP/USD pair collapsed by 200 pips. Thus, while the EUR/USD pair remains within a pronounced flat, the GBP/USD pair continues its downward correction, which is clearly visible on higher timeframes. We do not believe the correction will last long because the US dollar still lacks reasons to strengthen. Nevertheless, we want to remind novice traders that the overall correction on the daily timeframe is still relatively weak—it can continue purely for technical reasons. This results in a situation where the dollar has no reason to grow, but it may still rise for several more weeks quite freely. As the price broke below the uptrend line on the hourly timeframe, the short-term trend changed downward again. Thus, the resumption of the global uptrend can be expected only after a new trend reversal on the hourly chart. There were no significant reports in the UK yesterday, and in the US, the ISM Manufacturing PMI did not support dollar growth.
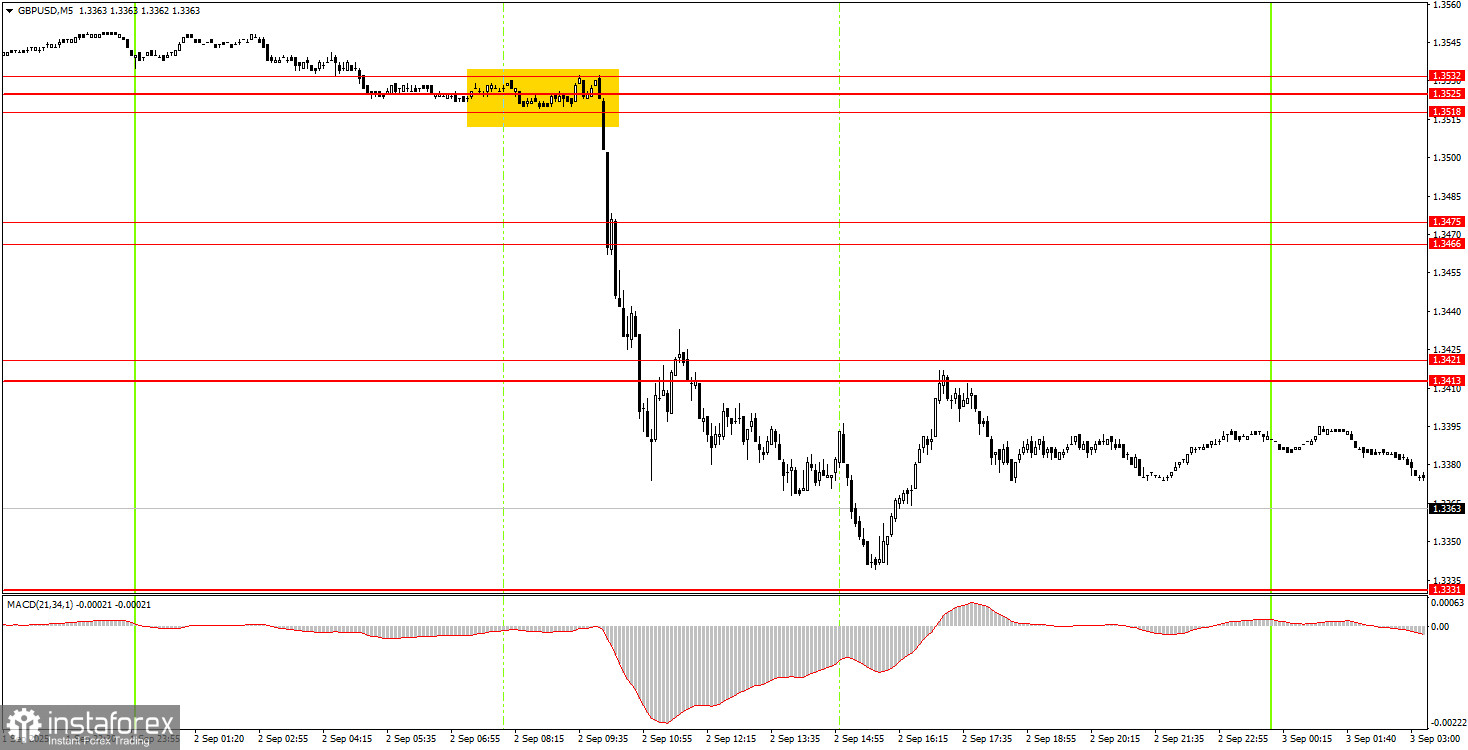
On the 5-minute timeframe on Tuesday, numerous trading signals were generated due to extremely high volatility. In the EUR/USD article, we mentioned that novice traders should not trade signals during such moves, which are extremely difficult to explain. However, the situation with the British pound was a bit different. The first sell signal formed near the 1.3518–1.3532 area. At the time, it was not yet clear what to expect in the coming hours. So, this was a simple and ordinary sell signal—a break through an important area. Thus, it could have been traded. After that, it all depended on where traders closed their short positions.
On the hourly chart, the GBP/USD pair showed a willingness to continue the global downward correction. The fundamental and macroeconomic background for the dollar has not become more attractive lately, so we still don't expect a strong strengthening. Nonetheless, the short-term trend on the hourly chart is now downward, so short positions can be considered. The main thing is for the market and price moves to become calmer.
On Wednesday, the GBP/USD pair may continue to move down, as yesterday's signal was a sell signal from a bounce off the 1.3413–1.3421 area. If macroeconomic data from the US turn out strong this week, the dollar may continue to rise.
On the 5-minute chart, you can now trade at the following levels: 1.3102–1.3107, 1.3203–1.3211, 1.3259, 1.3329–1.3331, 1.3413–1.3421, 1.3466–1.3475, 1.3518–1.3532, 1.3574–1.3590, 1.3643–1.3652, 1.3682, 1.3763. No important UK reports are scheduled for Wednesday, while in the US, the JOLTS report on July job openings will be released. The market may react to this report, but the response is unlikely to be strong.
Support and Resistance Levels: These are target levels for opening or closing positions and can also serve as points for placing Take Profit orders.
Red Lines: Channels or trendlines indicating the current trend and the preferred direction for trading.
MACD Indicator (14,22,3): A histogram and signal line used as a supplementary source of trading signals.
Important Events and Reports: Found in the economic calendar, these can heavily influence price movements. Exercise caution or exit the market during their release to avoid sharp reversals.
Forex trading beginners should remember that not every trade will be profitable. Developing a clear strategy and practicing proper money management are essential for long-term trading success.


