আরও দেখুন

 13.05.2025 11:02 AM
On Monday, the EUR/USD pair continued its decline after rebounding from the resistance zone of 1.1265–1.1282 on Friday. The pair consolidated below the 127.2% Fibonacci level at 1.1181 and fell to the support zone at 1.1074–1.1081. A rebound from this zone worked in favor of the euro, and the pair began to rise toward the 1.1181 corrective level. A consolidation below this zone would increase the likelihood of further decline toward the next support zone at 1.0944–1.0957.
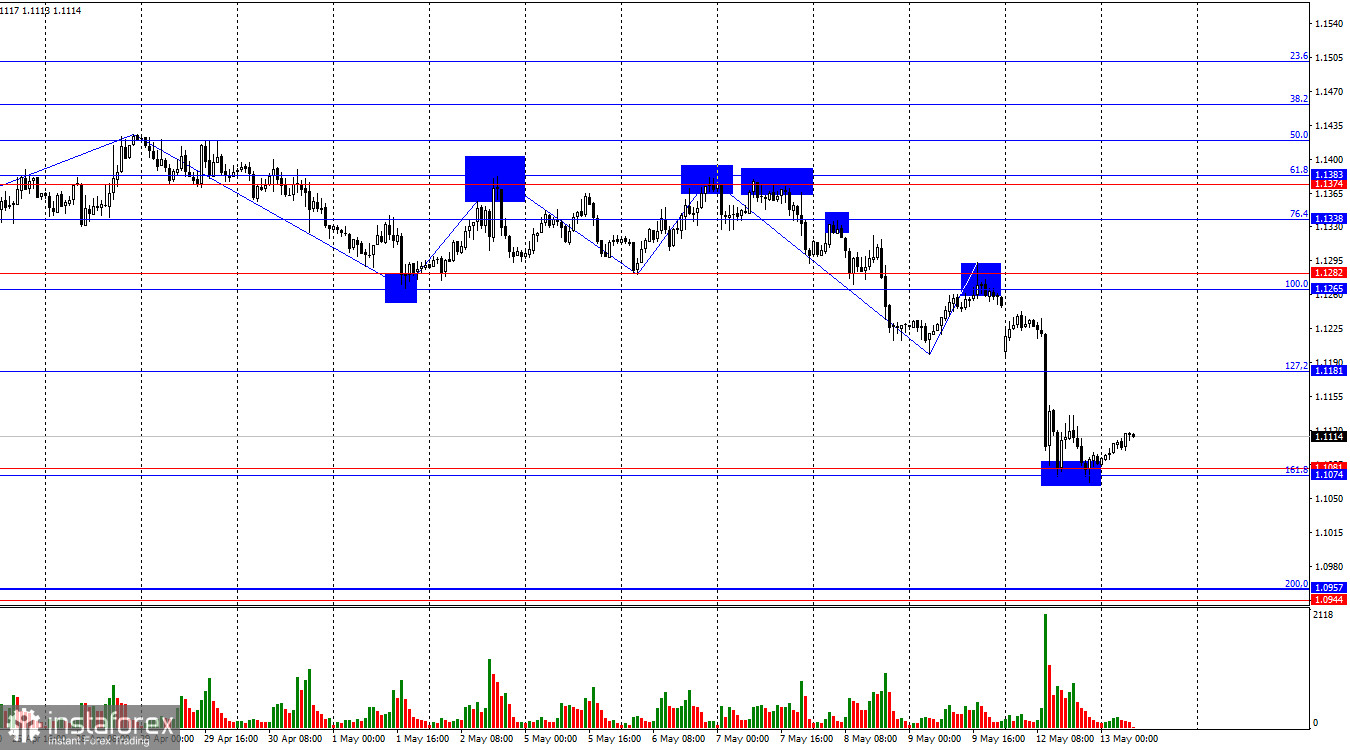
On the hourly chart, the wave structure has shifted. The last completed upward wave did not surpass the previous wave's peak, while the last downward wave broke through the previous low. This indicates a transition to a bearish trend. However, the waves have been weak recently, signaling low trader activity and overall weakness among the bears. News of successful talks between the U.S. and China supported the bears, but many challenges lie ahead.
On Monday, the news backdrop gave the bears new energy. Reports emerged that preliminary consultations on trade disputes between the U.S. and China resulted in a sharp reduction in tariffs on both sides. Few expected such progress from mere consultations—most anticipated lengthy negotiations. And rightfully so: the talks are just beginning, but the first round brings optimism.
With trade tensions easing, the U.S. dollar gained freedom and began rising sharply. This is likely not the ceiling for the dollar's growth, but it's important to recognize that we are still far from resolving all of the White House's trade disputes with other countries. No trade deals have been signed in over a month of negotiations—except with the UK. Future rounds between the U.S. and China could fail and trigger renewed escalation. Trade talks with the EU are not going as smoothly as those with China. Thus, the dollar received a strong growth factor, but technical signals are needed to support it further.
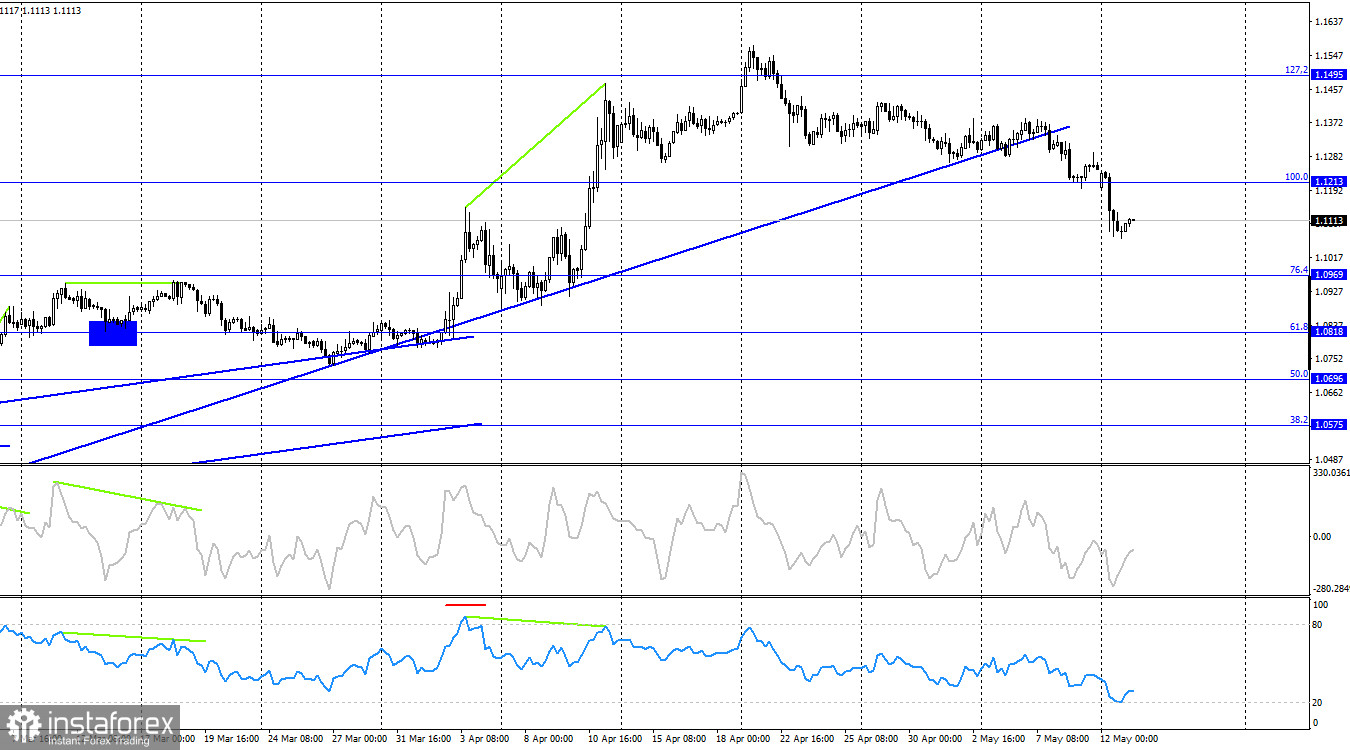
On the 4-hour chart, the pair consolidated below the 100.0% Fibonacci level at 1.1213. Therefore, the downward movement may continue toward the 76.4% Fibonacci level at 1.0969. A rebound from 1.0969 would suggest a possible rise toward 1.1213, while a consolidation below this level would increase the probability of further decline. No developing divergences are currently observed on any indicator.
Commitments of Traders (COT) Report
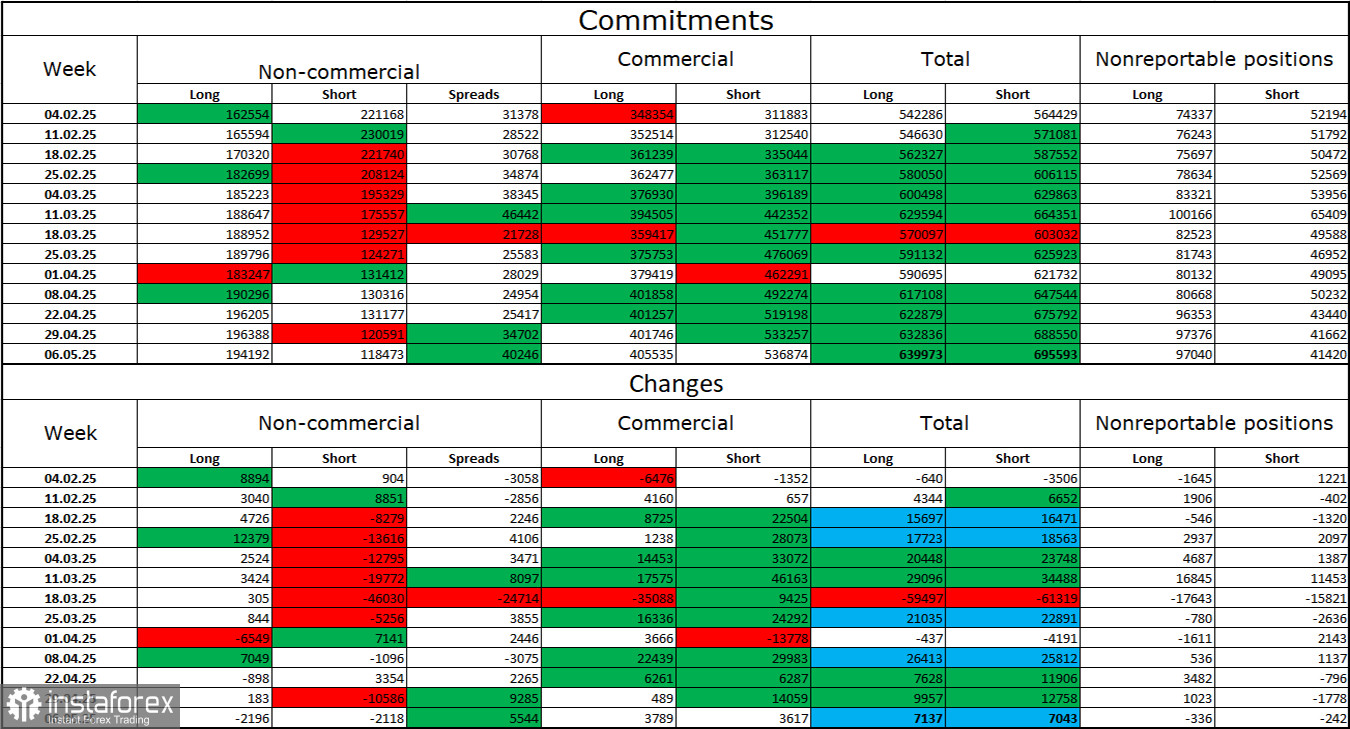
During the last reporting week, professional traders closed 2,196 long positions and 2,118 short positions. The "Non-commercial" group sentiment has long since turned bullish again—thanks to Donald Trump. Speculators now hold 194,000 long positions and 118,000 short positions. Just months ago, this situation was reversed with no warning of trouble ahead.
For 20 weeks, major players were offloading euros, but for the past 13 weeks, they've been cutting short positions and increasing longs. The difference in monetary policy approaches between the ECB and the Fed still favors the U.S. dollar, but Trump's actions continue to weigh heavily on the market, as his policy could trigger a U.S. recession.
News Calendar (EU & U.S.)
On May 13, the economic calendar includes one very interesting item (U.S. inflation) and two less impactful ones. Market sentiment is expected to be influenced by the data, especially in the second half of the day.
EUR/USD Forecast and Trading Tips
Sales were possible earlier on a rebound from 1.1374 on the hourly chart, targeting 1.1265. Selling was also possible from the resistance zone of 1.1265–1.1282, with targets at 1.1181 and 1.1074—all of which were reached. Today, short positions are possible upon a close below the 1.1074–1.1081 zone, targeting 1.0957. Buying may be considered on a rebound from the 1.1074–1.1081 zone on the hourly chart, targeting 1.1181.
Fibonacci grids are drawn from 1.1265–1.1574 on the hourly chart and from 1.1214–1.0179 on the 4-hour chart.


