See also

 23.06.2025 11:24 AM
On Friday, the EUR/USD pair continued to rise after rebounding from the 76.4% corrective level at 1.1454. However, on Monday night, the pair returned to this level. A new rebound allows for expectations of renewed growth in the euro toward the 100.0% corrective level at 1.1574. A consolidation of the pair's rate below 1.1454 would indicate the potential for further decline toward the support zone of 1.1374–1.1380.
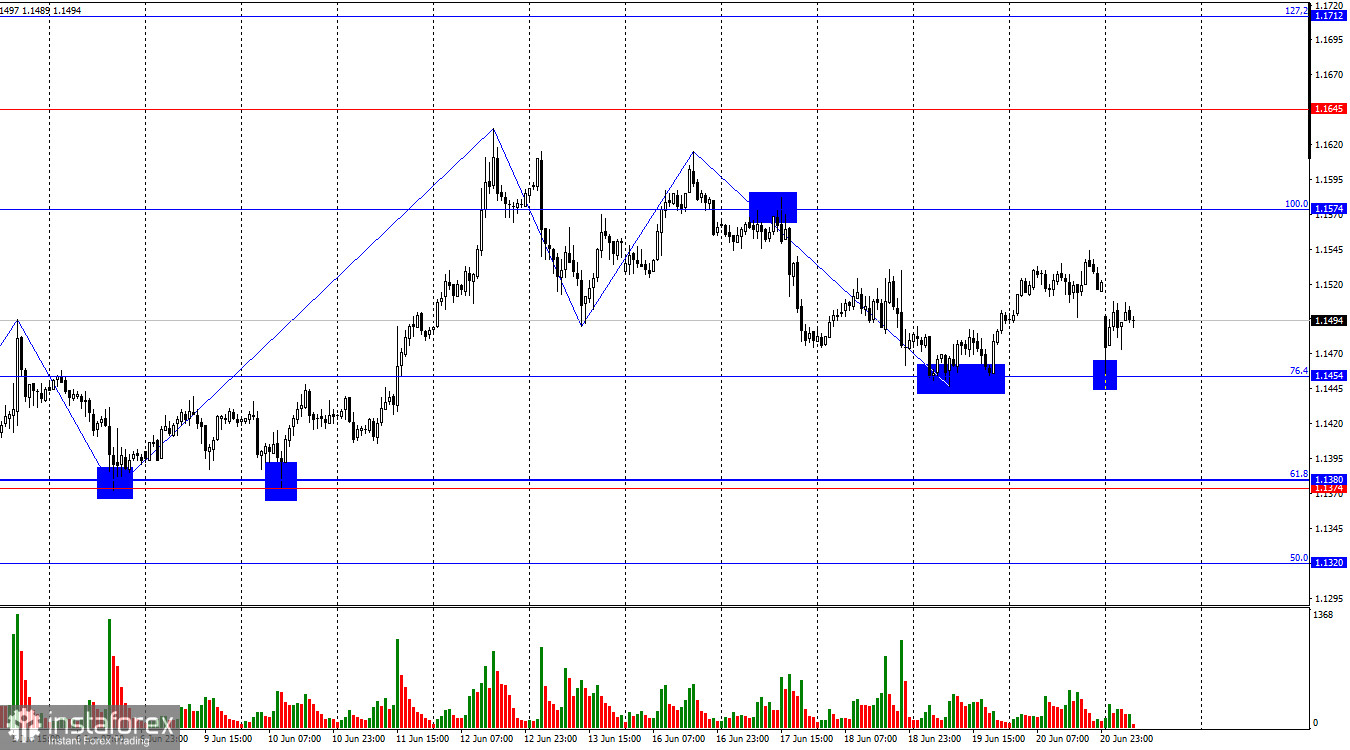
The wave pattern on the hourly chart remains straightforward. The last completed upward wave did not break the peak of the previous wave, while the new downward wave broke the previous low. This suggests the trend is shifting to bearish. The lack of progress in U.S.–China and U.S.–EU negotiations is discouraging bearish activity, and the Federal Reserve meeting did not support the dollar. Therefore, it's unclear whether the emerging bearish trend will gain strength.
There was little significant news on Friday, but on Saturday night, Donald Trump unexpectedly ordered a strike on Iran's nuclear facilities as part of an "anti-nuclear program." This marks the first U.S. military strike on Iran in nearly 50 years. Last week, Trump indicated that he would decide on how to address the Iran issue within two weeks, making Saturday's strike an unwelcome surprise for traders. Trump is now threatening Tehran with further strikes unless it agrees to dismantle all nuclear development efforts. Tehran remains firm in its stance. As a result, we may see further Iranian strikes on Israel or even on U.S. bases in the Middle East, as well as retaliatory strikes from the U.S. and Israel. The escalation of the conflict has once again failed to significantly benefit the dollar, which couldn't even consolidate below 1.1454. As I mentioned earlier, Trump's trade war and its long-term consequences are more significant to traders than the Middle East tensions.
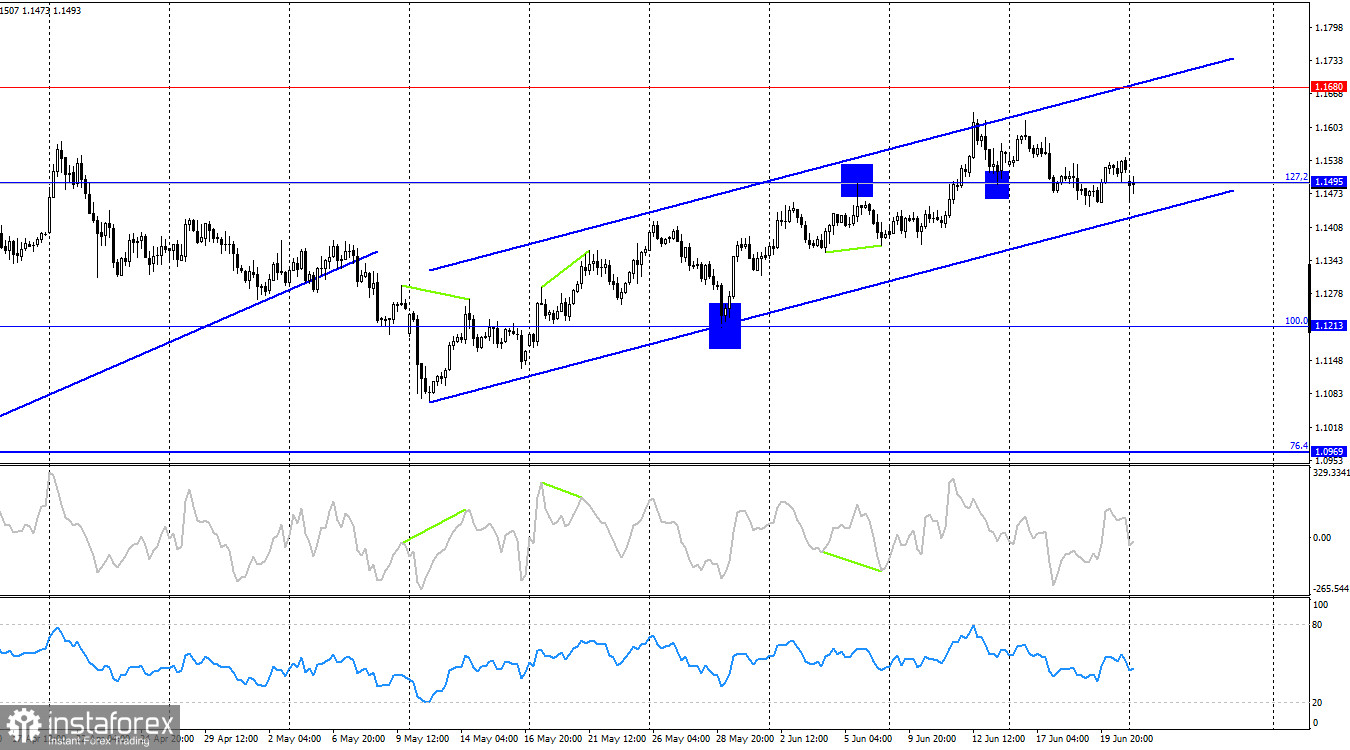
On the 4-hour chart, the pair returned to the 127.2% Fibonacci corrective level at 1.1495. The decline may continue toward the lower boundary of the ascending trend channel, which still indicates a bullish trend. A consolidation below this channel would support expectations for a deeper decline toward the 100.0% Fibonacci level at 1.1213. No divergences are developing on the indicators at the moment.
Commitments of Traders (COT) Report
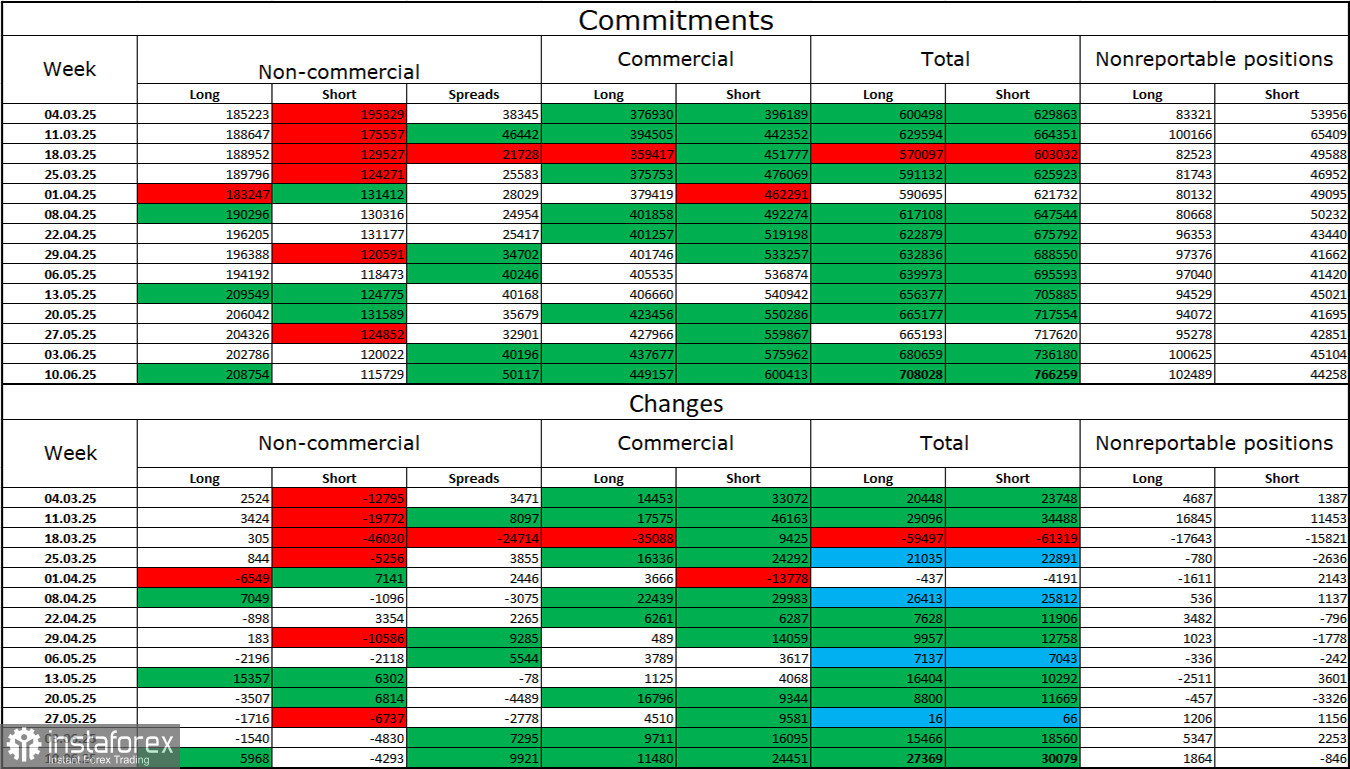
Over the last reporting week, professional traders opened 5,968 long positions and closed 4,293 short positions. Sentiment in the "Non-commercial" category remains bullish, driven by Donald Trump. The total number of long positions held by speculators now stands at 208,000 versus 115,000 short positions , and the gap—aside from rare exceptions—continues to widen. Thus, the euro remains in demand while the dollar does not. The situation remains unchanged.
For nineteen consecutive weeks, large traders have been reducing short positions and increasing longs. The difference in monetary policy (DMP) between the ECB and the Fed is already significant, but Donald Trump's policies are the more influential factor for traders, as they could trigger a recession in the U.S. and other long-term structural problems for the American economy.
Economic News Calendar for the U.S. and EU
European Union
United States
On June 23, the economic calendar is full of important releases. Thus, the news background will influence market sentiment throughout Monday.
EUR/USD Forecast and Trading Recommendations
Sales were possible after a close below the 1.1574 level on the hourly chart, targeting 1.1454. This target has been achieved. New selling opportunities may arise upon a close below 1.1454, targeting 1.1374–1.1380. I recommend considering long positions on a new rebound from 1.1454 with a target of 1.1574.
Fibonacci grids are built from 1.1574 to 1.1066 on the hourly chart and from 1.1214 to 1.0179 on the 4-hour chart.


