See also

 23.07.2025 09:01 AM
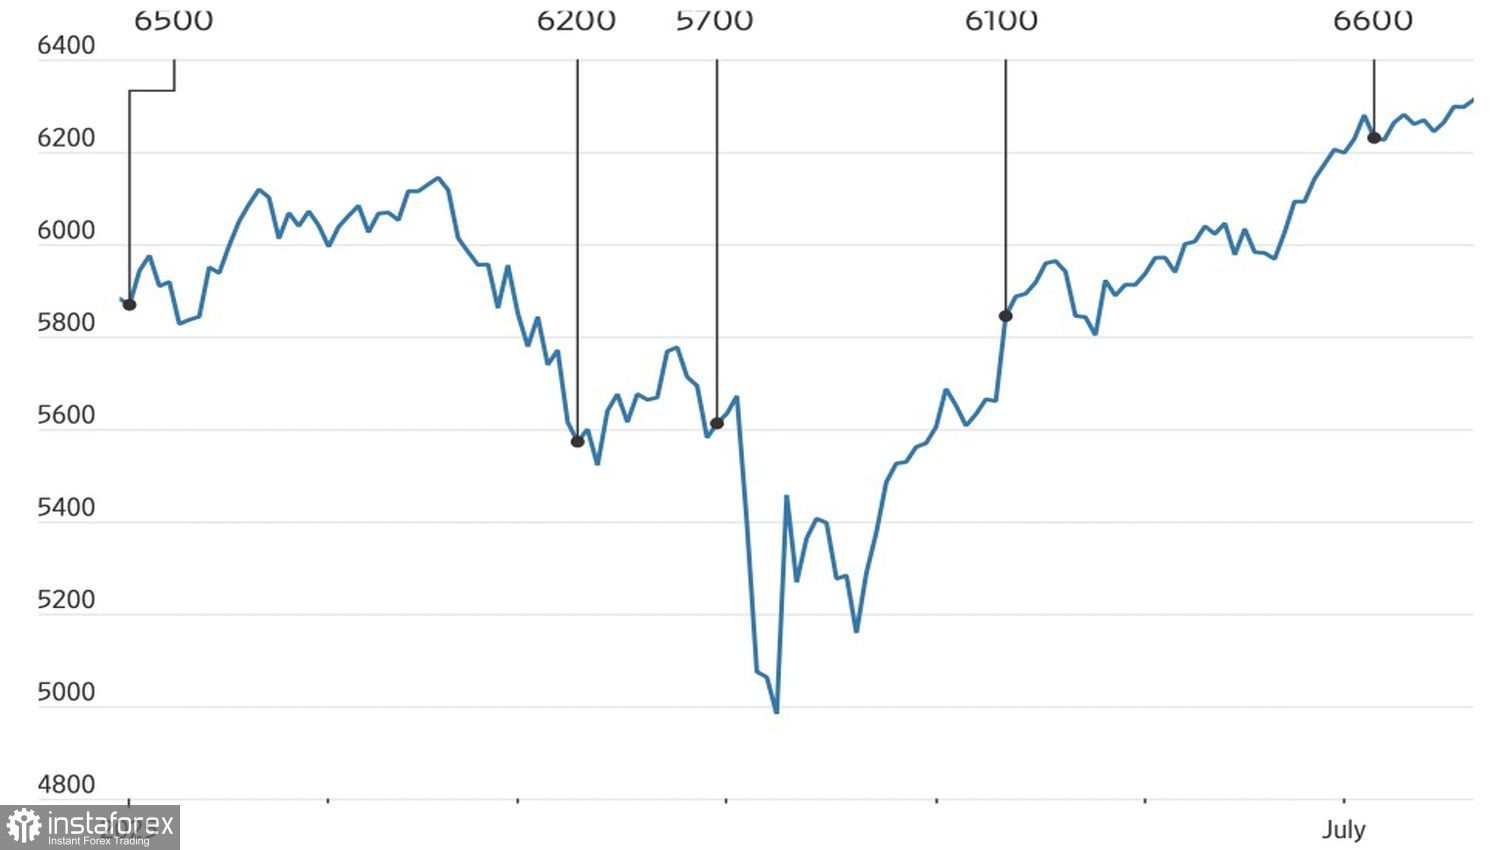
If something seems too good to be true, it probably is. The S&P 500 remains stuck in indecision near its all-time high, showing little reaction to positive developments. Neither the wave of new trade agreements nor Treasury Secretary Scott Bessent's reluctance to remove Jerome Powell helps the broad stock index. When an asset fails to move in the anticipated direction, it's more likely to shift in the opposite direction.
Donald Trump announced three more trade deals. Japan received a 15% tariff instead of the previously announced 25%, and tariffs on automobile imports were reduced to 15% for Tokyo. In exchange, Japan pledged to invest 550 billion dollars in the U.S. economy, with 90% of the profits from those investments going to Washington. Indonesia and the Philippines received 19% tariffs — less than the previously expected 32% and 20%. Moreover, Jakarta must also purchase 50 billion dollars' worth of U.S. goods.
Tariffs are driving equity indexes and prompting banks and major corporations to revise their S&P 500 forecasts. Investors now live in a new reality, where 10% is the new zero, and 15–20% is no longer considered high. According to Goldman Sachs, tariff hikes have likely slowed the U.S. economy and are fueling inflation. However, the White House continues to maintain an image of economic stability. U.S. goods will be exported to Asia tariff-free, and the resulting revenues will boost the U.S. budget.
At the same time, the outcomes of negotiations allow both sides to claim that they have reached favorable deals. This diverts attention from the serious economic consequences. Research from Deutsche Bank indicates that it's not foreign countries paying the tariffs, but rather American companies and consumers. General Motors, for example, has opted not to raise car prices, instead accepting a reduction in profits. If other companies follow suit, the resulting decline in earnings could pull the S&P 500 downward.
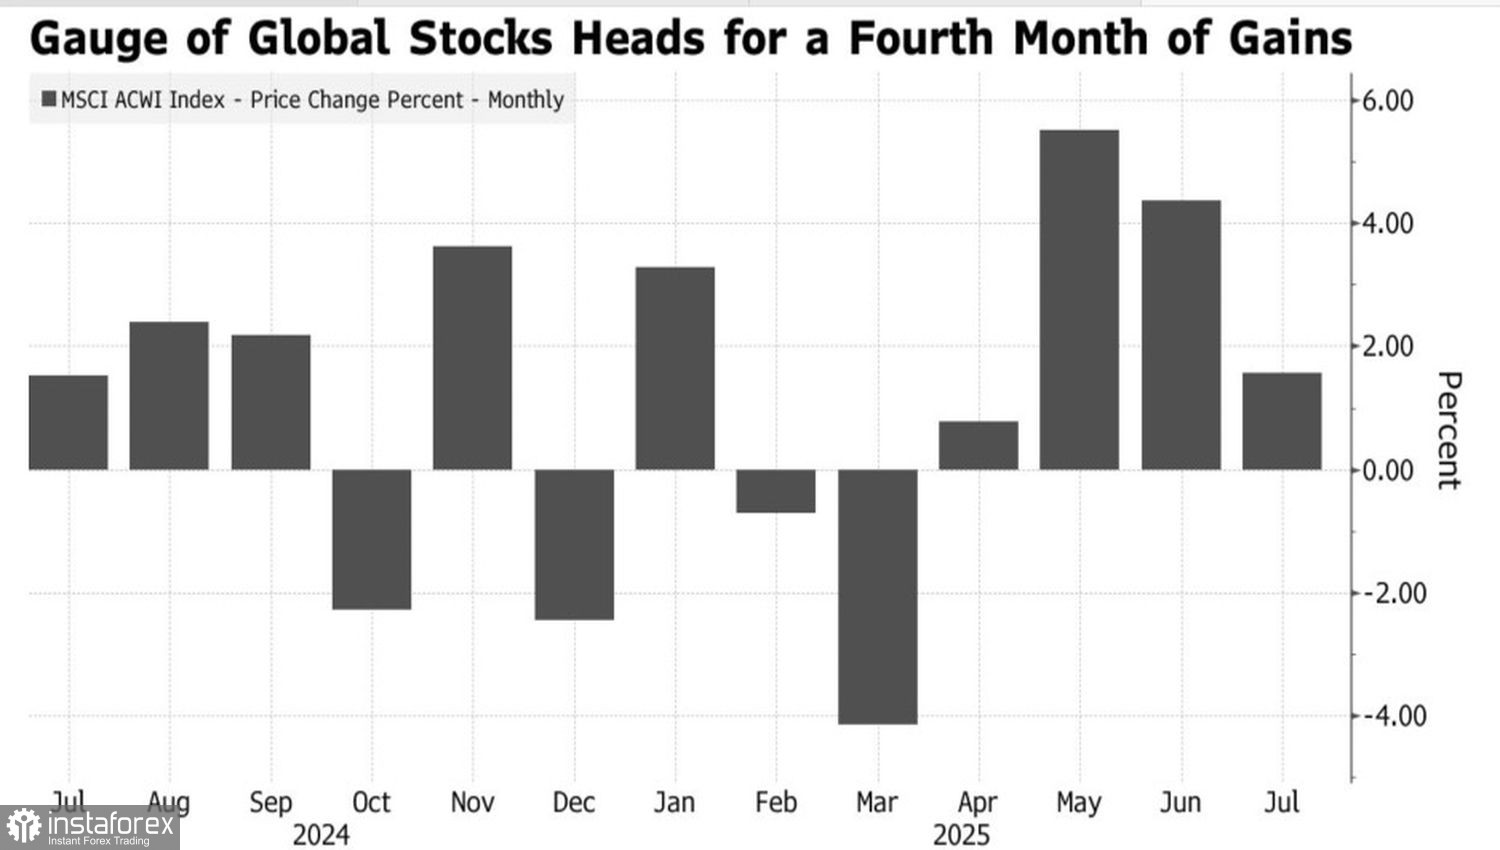
Nevertheless, the broad equity index remains at the top. Its rally continues to push global stock markets into the green for the fourth consecutive month.
The question is: how long will this euphoria last? Can the White House's supportive rhetoric keep the S&P 500 from falling? Or will the market finally start believing its eyes instead of its ears? A deterioration in U.S. macroeconomic data could serve as a cold shower for the broad index.
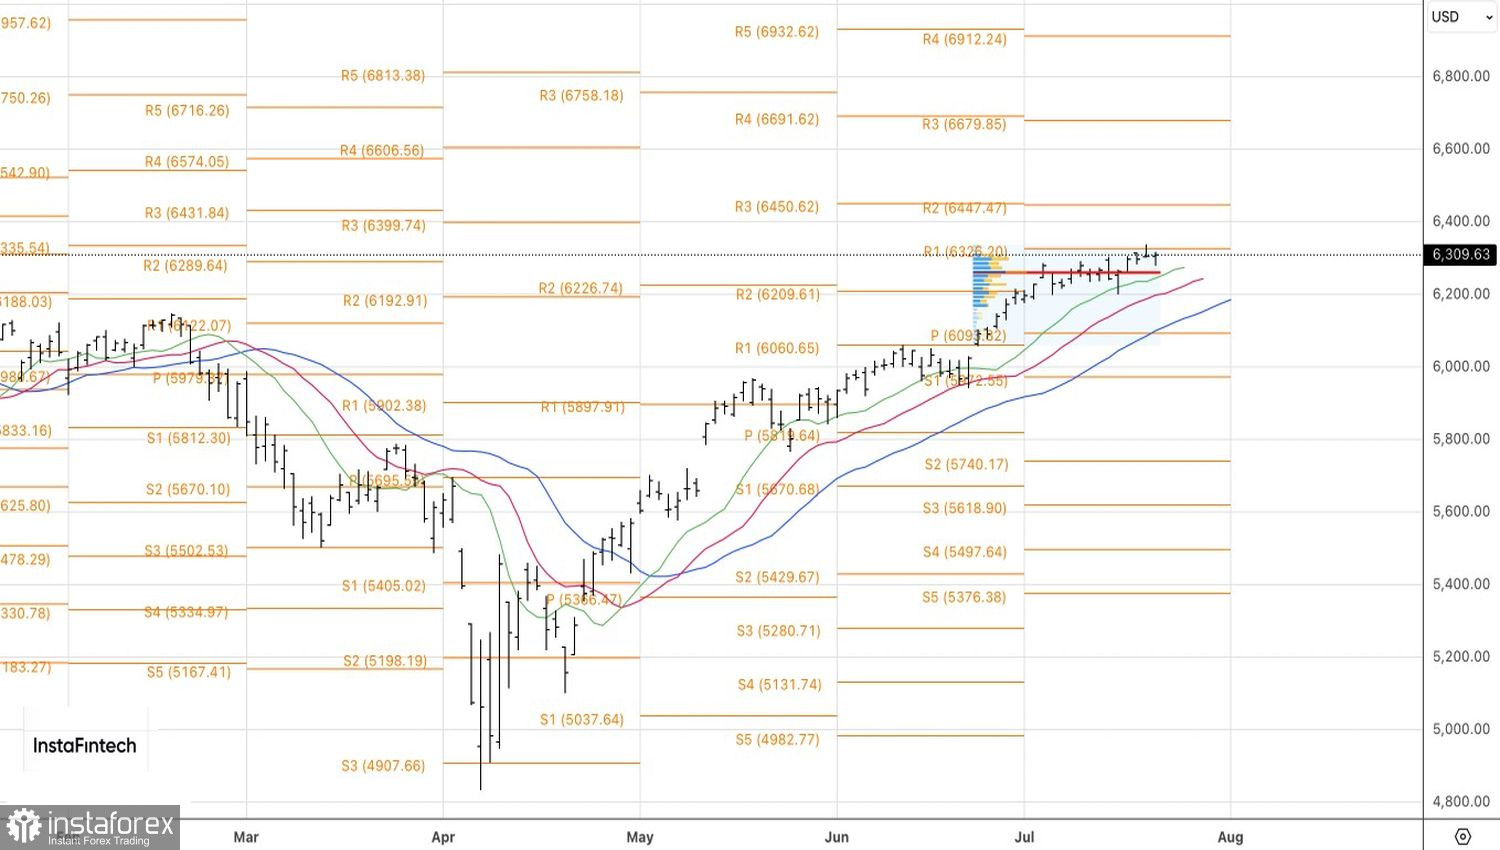
Technically, the daily chart of the S&P 500 shows two consecutive, opposing pin bars with long upper and lower shadows, indicating high market uncertainty. This setup can be traded by placing pending buy orders at 6335 and pending sell orders at 6280.


