See also

 03.09.2025 12:55 AM
Eurozone inflation has accelerated. The CPI growth report exceeded expectations—almost all components came out "in the green zone." Such results should have supported EUR/USD buyers, but the pair unexpectedly reversed south and, in just a few hours, plunged nearly one hundred points, much to the market's surprise.
The culprit was a suddenly strengthening dollar, which, without any clear reason, gained ground across the board. Such price spikes are inherently suspicious—especially now, amid the divergence between Fed and ECB rates. The report just reinforced the likelihood that the European Central Bank will maintain its wait-and-see position in the foreseeable future. At the same time, the probability of a Fed rate cut in September has already risen to 91% (according to the CME FedWatch tool), following the release of the ISM Manufacturing Index.
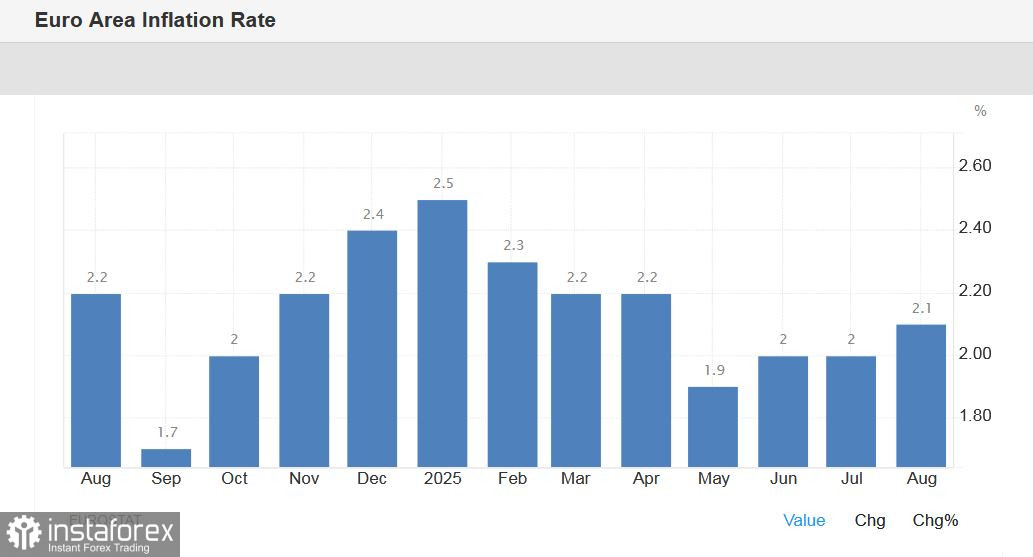
So, according to the published data, the headline Consumer Price Index in the Eurozone accelerated to 2.1% y/y. For the previous two months (June and July), the figure was at the 2% level, but in August it finally moved off that mark. The core CPI, excluding energy and food prices, remained at previous months' levels, i.e., at 2.3%, while most analysts had forecast a slowdown to 2.2% (or by other estimates, to 2.1%).
The main driver for the overall CPI growth was rising prices for food, alcohol, and tobacco. The increase was +3.2% compared to last year. In particular, the cost of unprocessed food rose 5.5% in August (compared to 5.4% the previous month), while energy prices fell by 1.9% (having declined by 2.4% in July).
At the same time, inflation in the services sector declined to 3.1% (from 3.2%)—its lowest reading since March 2022.
Overall, the release favored the euro. It's worth recalling that last Friday's German inflation data also exceeded forecasts. Germany's headline CPI accelerated to 2.2% y/y (the highest since July this year), and the harmonized EU index rose to 2.1% y/y. All components were "in the green."
What does today's report tell us?
Firstly, formally, overall Eurozone inflation has exceeded the ECB's 2% target for the first time since April this year. This is important, considering the outcome of the latest (July) ECB meeting.
Recall that in July, the central bank—as expected—kept all monetary policy parameters unchanged, but the results of the July meeting were interpreted as euro-positive. ECB President Christine Lagarde supported EUR/USD buyers during the post-meeting press conference, stating that the central bank could afford to "observe developments over the next few months" without taking action.
The August Eurozone CPI report allows the central bank to maintain this wait-and-see stance.
Incidentally, on Tuesday, after the CPI publication, ECB Executive Board member Isabel Schnabel advocated for maintaining a pause at upcoming meetings, suggesting that the Eurozone economy is demonstrating resilience, while inflation "may be higher than expected." According to her, the central bank's policy "is already moderately stimulating," and thus she sees no reason to continue lowering interest rates.
Thus, the fundamental backdrop for EUR/USD does not favor a sustained decline, especially since the US ISM Manufacturing Index remained in contraction territory (48.7), missing the forecast (48.9). Although new orders rose above 50 for the first time in 7 months (51.4), manufacturing continues to contract (47.8), indicating declining output. The prices paid index (an important inflation gauge) slightly decreased but stayed high (63.7).
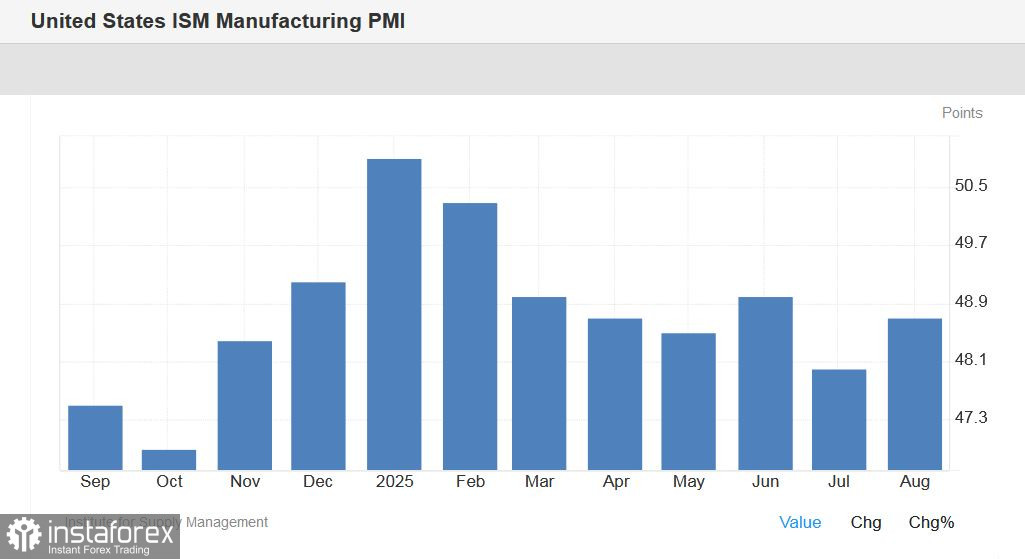
In other words, this is another argument in favor of a Fed rate cut at the August meeting.
All of this indicates that the EUR/USD pair retains upward potential.
From a technical perspective, on the daily chart, the pair remains between the middle and upper lines of the Bollinger Bands and above all Ichimoku lines (including the Kumo cloud). So, despite the bearish impulse, the technical structure on D1 (so far) has not changed. Meanwhile, bears are testing the 1.1650 target, which coincides with the middle Bollinger Band and the top of the Kumo cloud on D1. If sellers fail to break and hold below this support level, long positions will again become relevant—with targets at 1.1690 (middle Bollinger Band on H4) and 1.1740 (upper Bollinger Band on the same timeframe).


