See also

 26.09.2025 06:48 AM
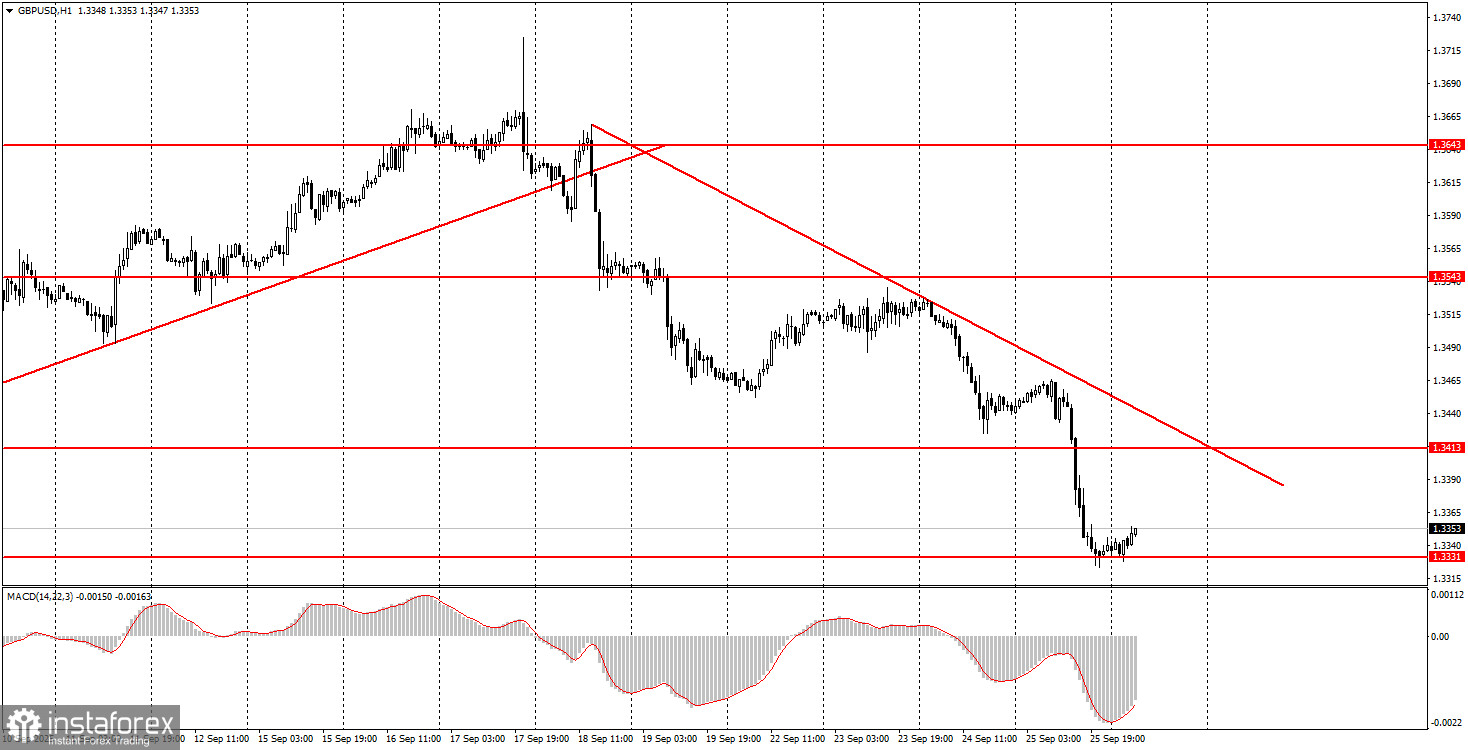
The GBP/USD pair also plunged on Thursday. Recall that the British pound had grounds for its latest downward move. We cannot say these reasons were unambiguous—many factors were interpreted by the market against the pound, though they could've been seen the other way around. However, on Thursday, the US GDP and durable goods orders reports could only be interpreted as favorable to the US dollar. Q2 GDP came in at +3.8%, while durable goods orders rose by 2.9%—in both cases, much stronger than forecasts. Thus, more positive reports triggered growth in the US currency, fully supporting the current downward trend, now reaffirmed by the trend line. However, it's worth remembering that quite specific events triggered the dollar's rise over the past week. The dollar will need more data in its favor for sustained growth. It's not ready for an independent trend.
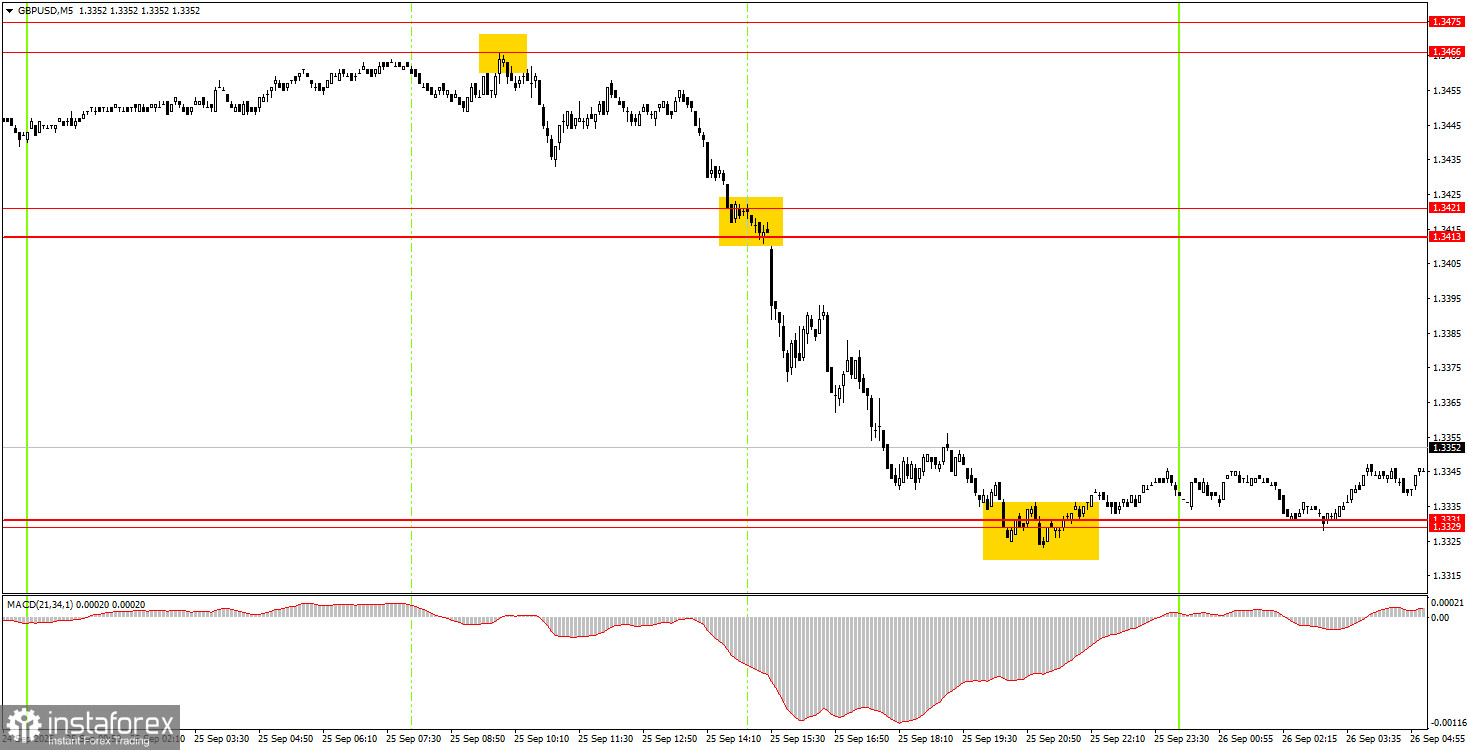
In the 5-minute time frame, Thursday saw a bounce from the 1.3466 level during the European session, which allowed short positions to be opened from the morning. At the start of the US session, the 1.3413–1.3421 area was easily broken, and by the end of the day, the pair reached the 1.3329–1.3331 zone. Thus, with just one short trade, even novice traders could have made around 120 pips from a relatively simple signal.
On the hourly chart, the GBP/USD pair continues to form a new downward trend. As we've said, there are no grounds for a prolonged dollar rally, so in the medium term, we expect moves only northward. Recent developments in the UK and the US have indeed supported the US currency, and the dollar's appreciation was justified. But globally, the fundamental background still does not favor it.
On Friday, the GBP/USD pair could continue to fall—but this will require new data to support the decline. If the price breaches the 1.3329–1.3331 region, this will serve as a signal to open positions with a target at 1.3259. At present, the price has bounced from this zone twice, so longs targeting 1.3413–1.3421 are also relevant.
On the 5-minute time frame, you can trade by using levels: 1.3102–1.3107, 1.3203–1.3211, 1.3259, 1.3329–1.3331, 1.3413–1.3421, 1.3466–1.3475, 1.3529–1.3543, 1.3574–1.3590, 1.3643–1.3652, 1.3682, 1.3763. On Friday, the UK calendar is empty, and in the US, only two reports are worth attention: the Core PCE Price Index and the University of Michigan Consumer Sentiment Index. In both cases, a market reaction should only be expected if the data deviates from forecasts.
Support and Resistance Levels: These are target levels for opening or closing positions and can also serve as points for placing Take Profit orders.
Red Lines: Channels or trendlines indicating the current trend and the preferred direction for trading.
MACD Indicator (14,22,3): A histogram and signal line used as a supplementary source of trading signals.
Important Events and Reports: Found in the economic calendar, these can heavily influence price movements. Exercise caution or exit the market during their release to avoid sharp reversals.
Forex trading beginners should remember that not every trade will be profitable. Developing a clear strategy and practicing proper money management are essential for long-term trading success.


