यह भी देखें

 29.09.2025 07:36 AM
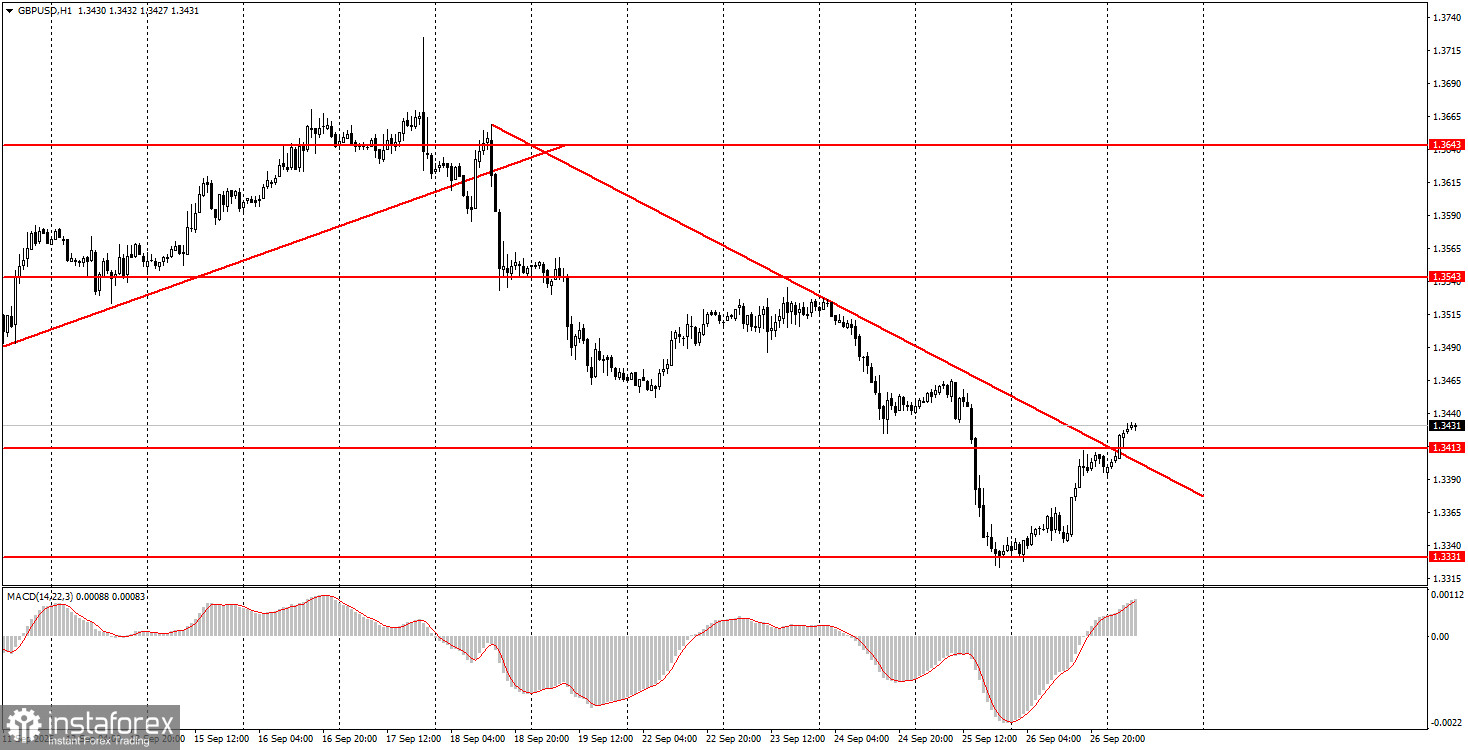
On Friday, the GBP/USD pair began an upward move, and by Monday night, it had already broken through the local descending trendline. Thus, the bearish trend has been canceled. Recall that over the past week and a half, the pound sterling was caught in a vortex of negative developments, which triggered its decline — a scenario many traders did not expect. However, the global fundamental backdrop for GBP/USD remains unchanged, and therefore, we do not anticipate a further medium-term decline of the British currency.
On Friday, the U.S. dollar came under pressure after the University of Michigan Consumer Sentiment Index once again showed a decline — a trend that has persisted for several months. Meanwhile, the pound extended its recovery into Monday. It is worth recalling that just a few days ago, Donald Trump introduced new tariffs on imports, including medicines, furniture, and trucks. The trade war is not only continuing but also expanding, and the market reacts sharply to every new round of tariffs or sanctions. As a result, pressure continues to mount on the U.S. dollar.
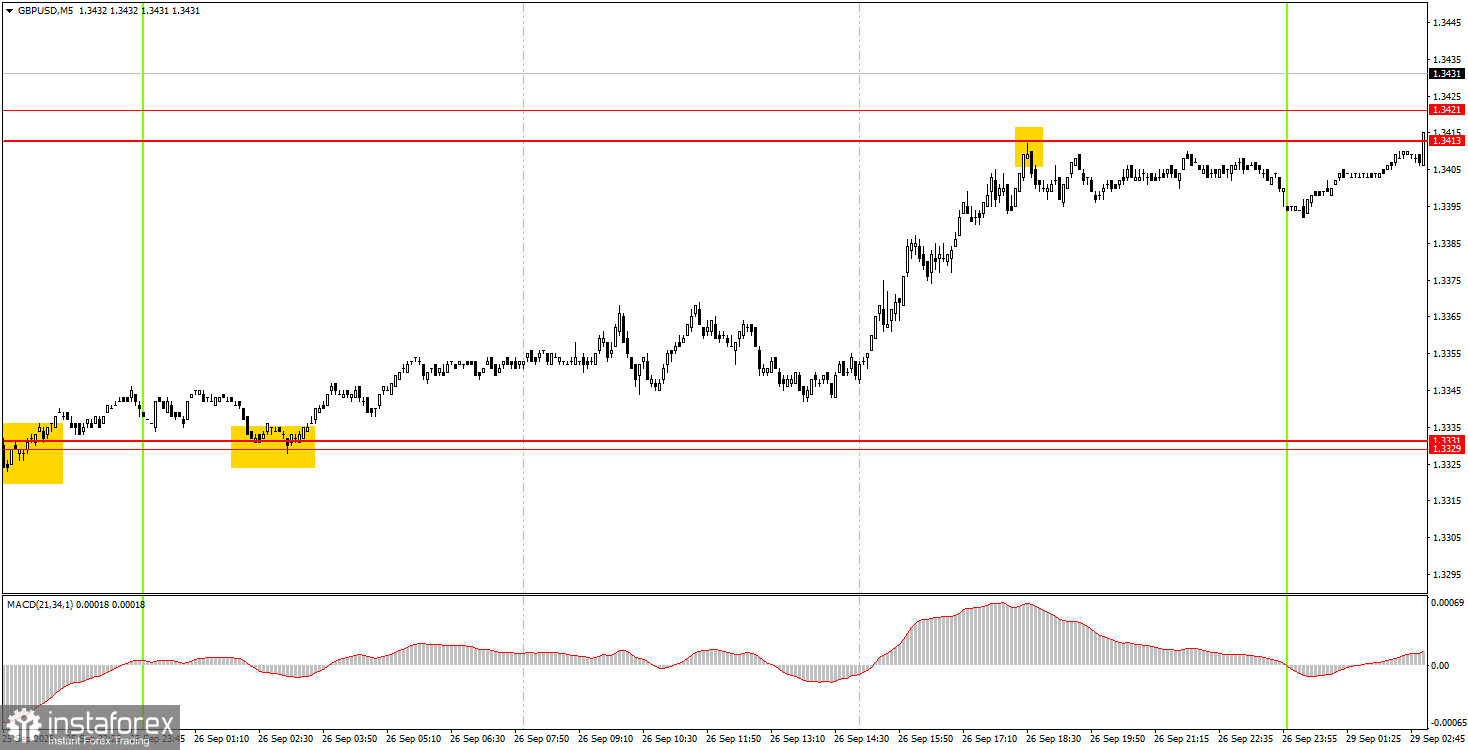
On the 5-minute timeframe, a strong buy signal was formed during the Asian session on Friday. The price rebounded from the 1.3329–1.3331 area, and by the start of the European session, it had moved only about 10 pips away from the signal level. This gave novice traders a clear opportunity to open long positions. During the U.S. session, the price reached the nearest target at 1.3413–1.3421, generating at least 60 points of profit.
On the hourly chart, GBP/USD has completed its bearish phase. As mentioned earlier, we see no grounds for prolonged dollar strength, so in the medium term, we expect the pair to continue moving north. Recent events in both the U.K. and the U.S. did temporarily support the dollar, and its rise was justified. Still, the broader fundamental backdrop remains unfavorable for the greenback.
On Monday, GBP/USD may extend its upward move, as the downtrend is already over. The price has broken through the 1.3413–1.3421 area, providing traders with an opportunity to open new long positions. The next target lies at 1.3466–1.3475.
On the 5-minute chart, relevant intraday levels are: 1.3102–1.3107, 1.3203–1.3211, 1.3259, 1.3329–1.3331, 1.3413–1.3421, 1.3466–1.3475, 1.3529–1.3543, 1.3574–1.3590, 1.3643–1.3652, 1.3682, 1.3763. Since Monday's calendar in both the U.K. and the U.S. contains no major events, volatility will likely remain subdued.
Support and Resistance Levels: These are target levels for opening or closing positions and can also serve as points for placing Take Profit orders.
Red Lines: Channels or trendlines indicating the current trend and the preferred direction for trading.
MACD Indicator (14,22,3): A histogram and signal line used as a supplementary source of trading signals.
Important Events and Reports: Found in the economic calendar, these can heavily influence price movements. Exercise caution or exit the market during their release to avoid sharp reversals.
Forex trading beginners should remember that not every trade will be profitable. Developing a clear strategy and practicing proper money management are essential for long-term trading success.

