یہ بھی دیکھیں

 26.09.2025 04:28 AM
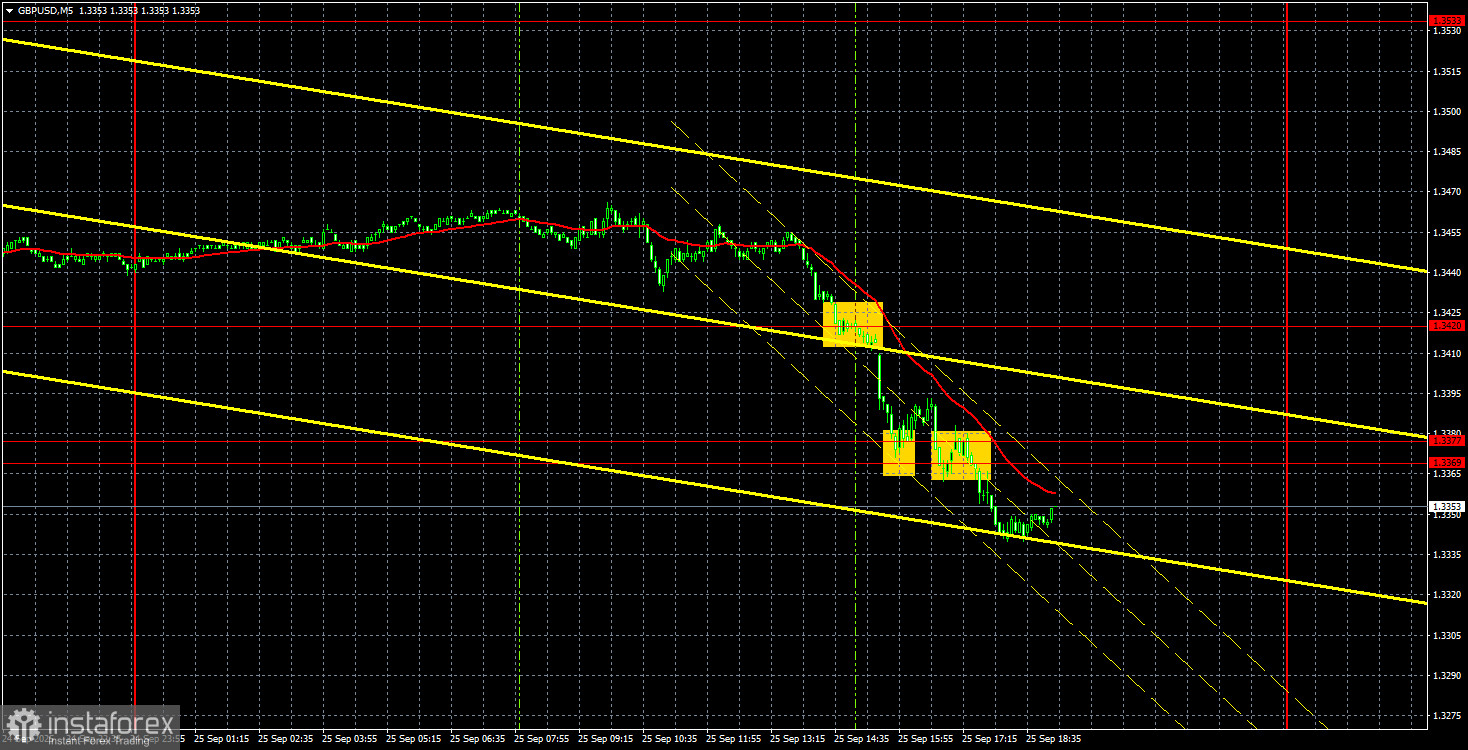
The GBP/USD currency pair continued its downward movement on Thursday. Recall that the "black streak" for the British currency began last week. Over this period, both news events genuinely worked against the pound, and events that could be interpreted in various ways. In almost all cases, traders chose to interpret the news unfavorably for the British currency. Yesterday, the fall of the GBP/USD pair was entirely justified, as US data turned out to be far better than forecasts. US GDP grew in the second quarter by 3.8% versus initial forecasts of about 3%, and durable goods orders increased by 2.9% despite negative expectations.
From a technical standpoint, everything is logical as well. A new downward trend has formed. Since the price breached the uptrend line, the decline has continued almost without interruption. Of course, it might have been much weaker if the market hadn't interpreted every bit of news against the pound, but we can't blame traders for this. Market makers see the situation with the Bank of England and the Fed in a somewhat unfavorable light for the British currency. That said, the broader fundamentals remain sharply negative for the dollar. All that remains is to wait for a new upward trend to emerge.
On the 5-minute timeframe, several trading signals were formed yesterday, although not as strong as those on the euro. First, the price broke through the 1.3420 level, allowing traders to open short positions. The nearest target—1.3369-1.3377—was reached, but the bounce from it turned out to be false. A bit later, the price broke and consolidated below this area, which once again allowed for opening shorts. Overall, only one trade was unprofitable, while two were profitable.
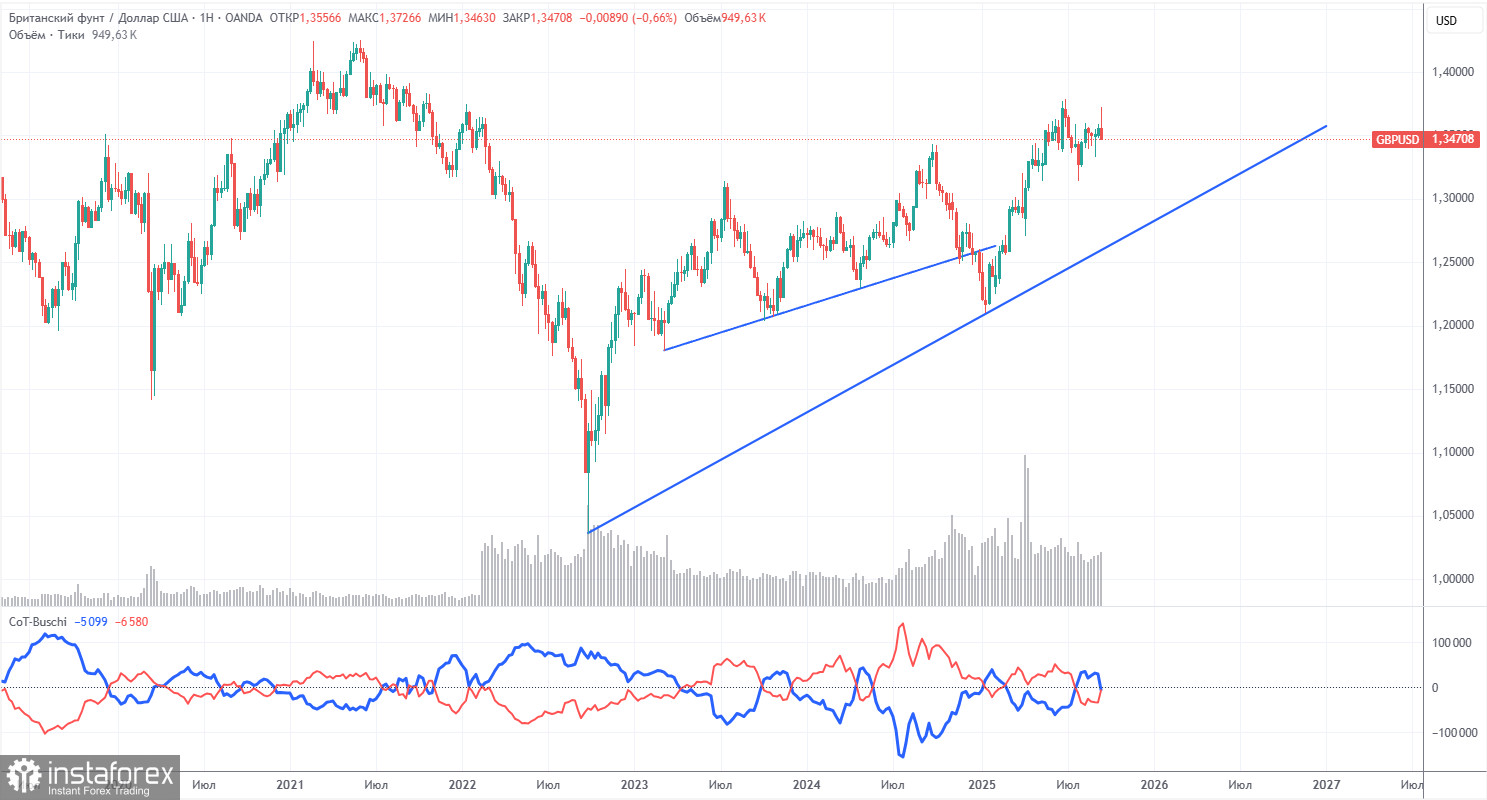
COT reports for the pound show that commercial traders' sentiment has been shifting constantly in recent years. The red and blue lines, reflecting the net positions of commercial and non-commercial traders, frequently cross and usually hover close to zero. Right now, they're nearly at the same level, meaning the number of buy and sell positions is roughly equal.
The dollar continues to fall due to Donald Trump's policies, so at this point, market maker demand for the pound is not very significant. The trade war will likely persist in one form or another for a considerable time to come. The Fed will lower rates in the coming year regardless. Dollar demand will inevitably decline. According to the latest report on the pound, the "Non-commercial" group added 5,900 new BUY contracts and closed 21,100 SELL contracts. As a result, the net position of non-commercial traders rose by 27,000 contracts over the week.
In 2025, the pound has made significant gains, but the reason is clear: Donald Trump's policies. Once this fundamental driver fades, the dollar may start to strengthen again, but no one knows when that will be. The net position for the pound doesn't matter much; for the dollar, it keeps dropping, and generally at a faster rate.
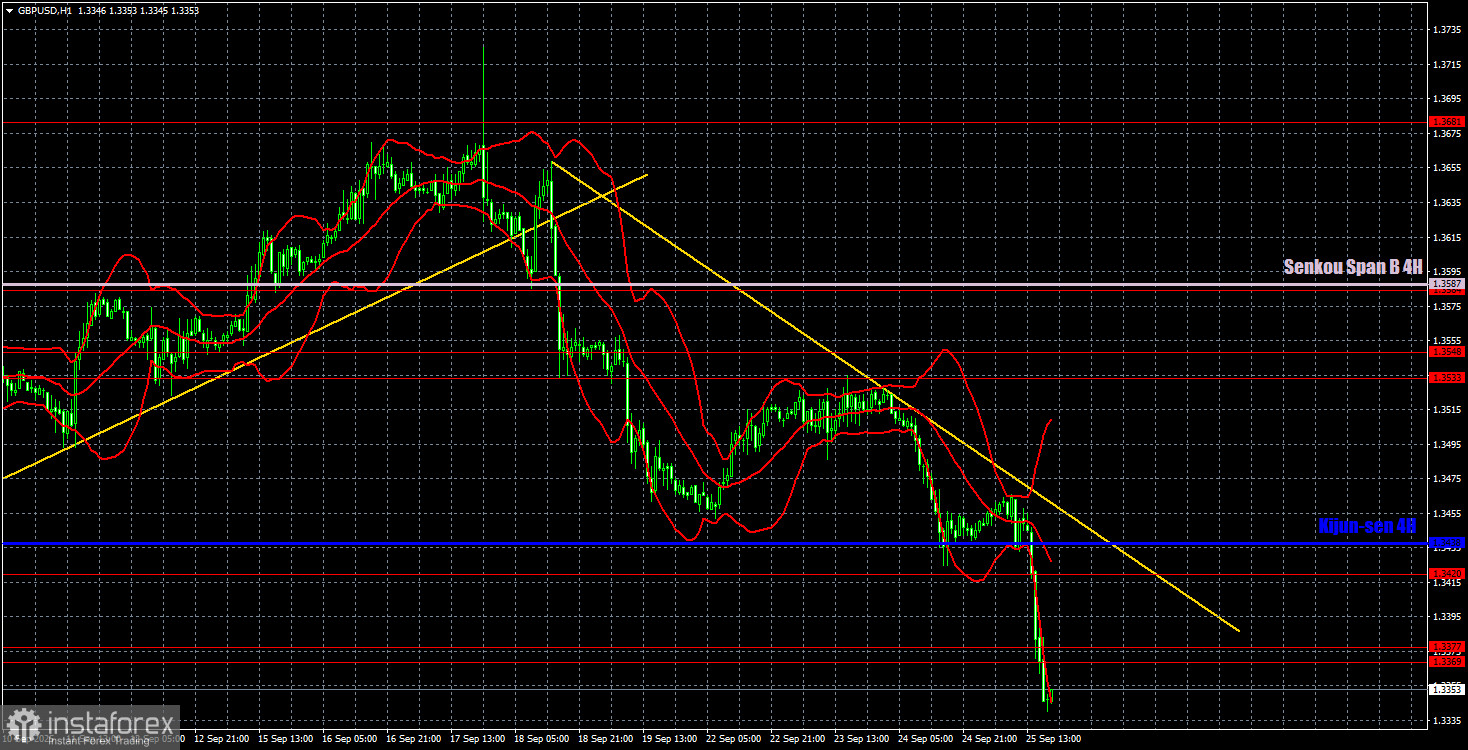
On the hourly timeframe, the GBP/USD pair began falling last week due to a negative fundamental background, and this week the decline continues for the same reason. A new downward trend has started. There are still no global reasons for the dollar to strengthen, so we expect the 2025 uptrend to resume in almost any case. However, for now, the local trend is clearly downward.
For September 26, we highlight the following important levels: 1.3125, 1.3212, 1.3369–1.3377, 1.3420, 1.3533–1.3548, 1.3584, 1.3681, 1.3763, 1.3833, 1.3886. The Senkou Span B line (1.3587) and Kijun-sen line (1.3438) can also be sources for signals. A stop loss is recommended to be set to breakeven once the price moves 20 points in the correct direction. The Ichimoku indicator lines may shift during the day, which should be taken into account when identifying trading signals.
On Friday, the UK calendar is empty, while in the US, the Core Personal Consumption Expenditure Index, the University of Michigan Consumer Sentiment Index, and reports on personal incomes and spending will be published. These are not the biggest reports, but they may nonetheless provoke a market reaction if values are resonant.
Today, traders can expect the decline to continue since the trend is clearly downward. The price has broken through the 1.3369–1.3377 area, allowing you to stay in shorts with a target of 1.3212. It is not a given that the pound will fall that low, but that is the target.


