یہ بھی دیکھیں

 29.09.2025 04:02 AM
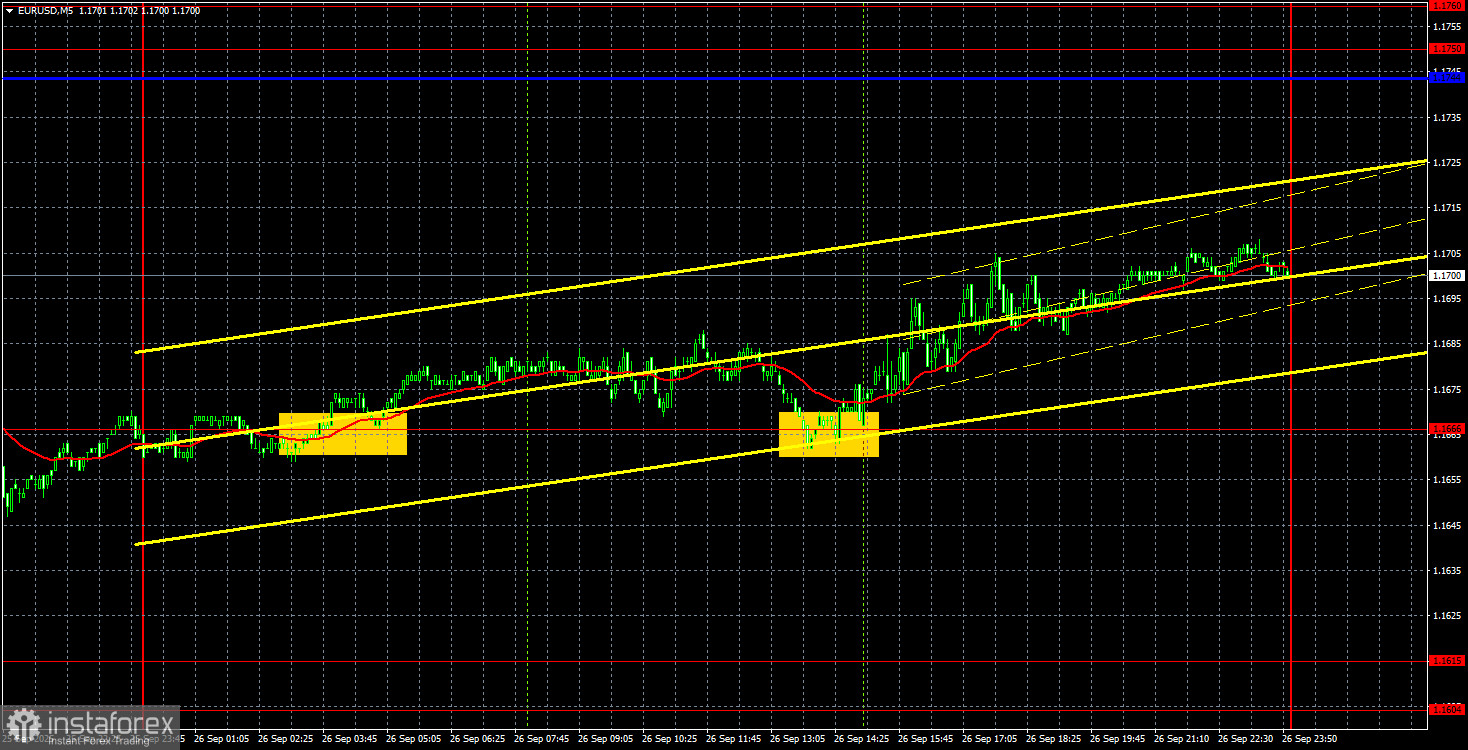
On Friday, the EUR/USD pair experienced an upward movement, which represents a correction within the broader downtrend. The descending trendline clearly indicates the prevailing bearish sentiment among most traders, but we would still not expect a strong dollar rally. It is essential to recognize that over the past week and a half, several factors have indeed supported the U.S. currency; however, all of them are temporary. The global trend remains unchanged, as does the overall fundamental background. Thus, we are witnessing another round of correction, but the dollar still finds it extremely difficult to count on more than that.
On Friday, European Central Bank President Christine Lagarde delivered another speech in the euro area, but it provided no new information to the market. In the U.S., three reports were released, two of which the market ignored. The Core PCE price index stood at 0.2% in August, in line with forecasts. Personal income and consumer spending grew slightly above expectations. Only the University of Michigan Consumer Sentiment Index triggered a minor market reaction, although its result did not deviate significantly from forecasts. Nonetheless, consumer sentiment has been declining since December last year, which "paradoxically" coincides with Donald Trump's return to the White House.
On the 5-minute timeframe, two very good trading signals were formed on Friday. The price twice rebounded from the 1.1666 level. On the second attempt, the upward movement finally began, and the euro managed to gain about 25 pips by the end of the day. Volatility on Friday was weak, so there was no reason to expect large profits.
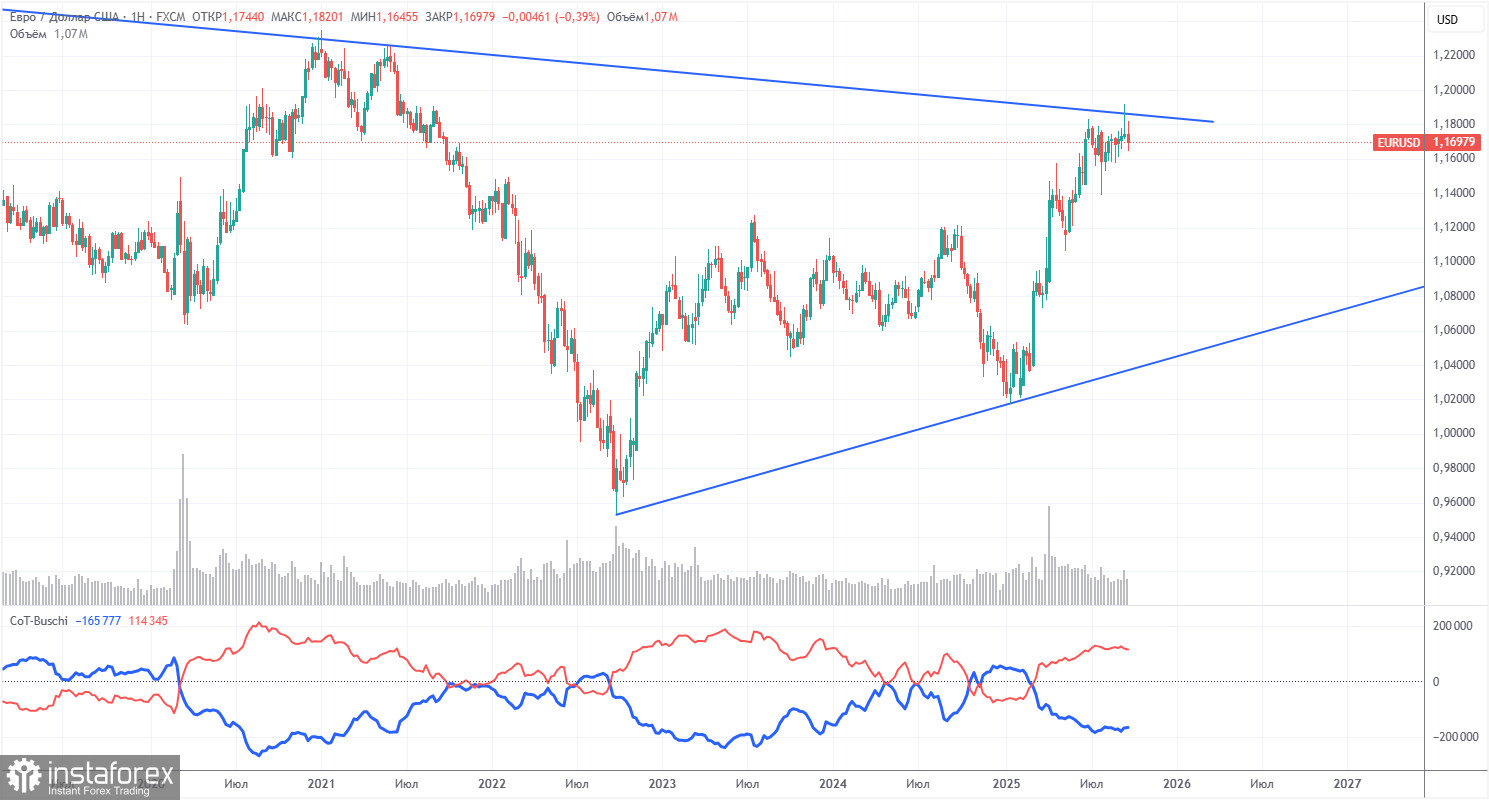
The latest COT report is dated September 16. As the chart above clearly shows, the net position of non-commercial traders had long been bullish, with bears barely gaining the upper hand at the end of 2024 before quickly losing it again. Since Donald Trump assumed office for the second time, the dollar has continued to decline. We cannot say with 100% certainty that this decline will continue, but current global developments strongly suggest that it will.
We still do not see any fundamental drivers for strengthening the euro, while numerous factors remain in place that could lead to the dollar's decline. The long-term downtrend remains intact, but what does it matter when the price has been moving in this direction for the past 17 years? Once Trump ends his trade wars, the dollar may recover, but recent events suggest that such wars will persist in one form or another. The possible loss of Fed independence is another powerful factor weighing on the U.S. currency.
The red and blue indicator lines continue to point to a "bullish" trend. During the last reporting week, the number of long positions among the "Non-commercial" group decreased by 800, while the number of shorts increased by 2,600. As a result, the net position fell by 3,400 contracts.
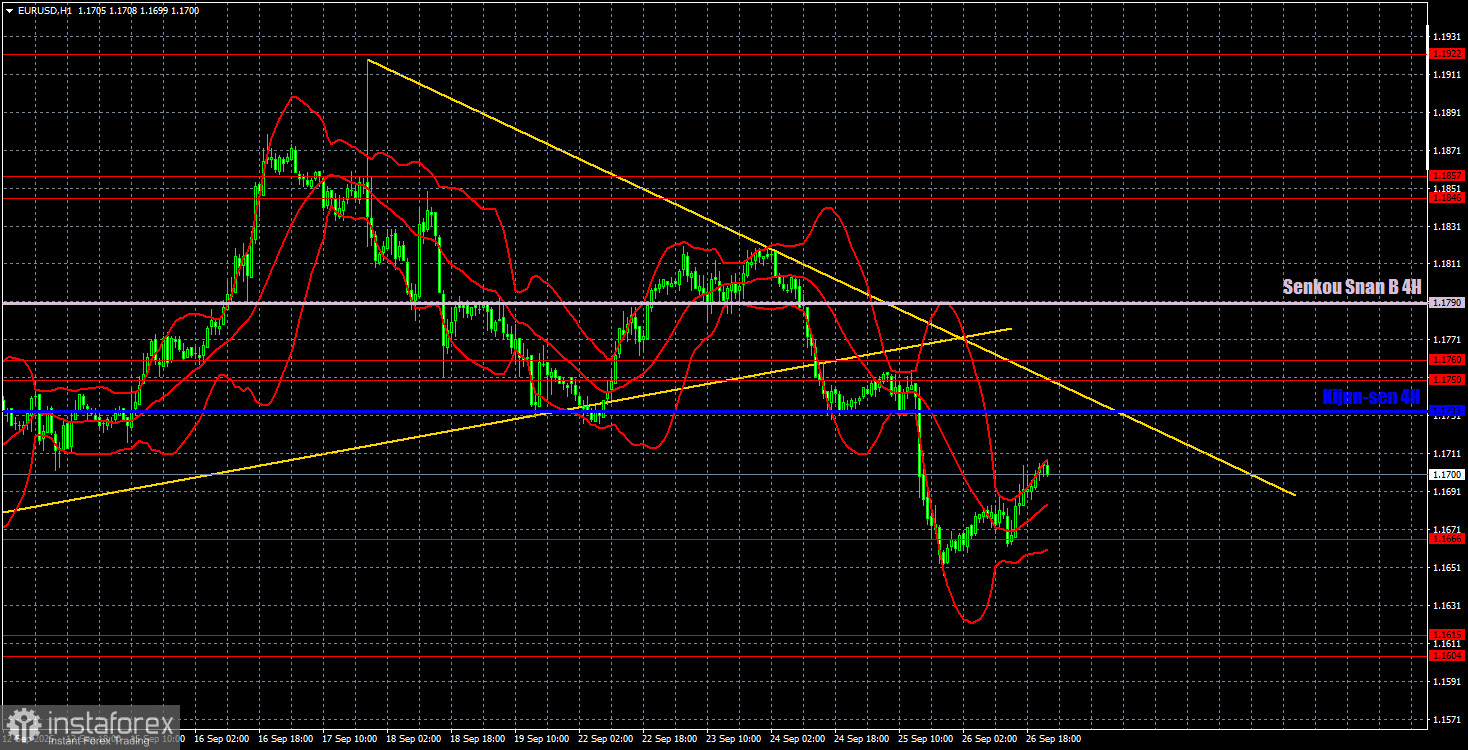
On the hourly timeframe, the EUR/USD pair is forming a new downward trend, as indicated by a trendline. We still see no grounds for a prolonged dollar rally. On the daily timeframe, the uptrend remains intact, although the dollar's strengthening appears to be weakening. On lower timeframes, the U.S. currency is rising, but it is difficult to predict how long this trend will persist.
For September 29, we highlight the following levels for trading: 1.1234, 1.1274, 1.1362, 1.1426, 1.1534, 1.1604–1.1615, 1.1666, 1.1750–1.1760, 1.1846–1.1857, 1.1922, 1.1971–1.1988, as well as the Senkou Span B line (1.1790) and the Kijun-sen line (1.1733). The Ichimoku indicator lines may shift during the day, which should be considered when identifying trading signals. Don't forget to place the Stop Loss order at breakeven once the price moves 15 pips in the right direction. This will protect against potential losses if a signal turns out to be false.
On Monday, no important macroeconomic reports are scheduled in either the euro area or the U.S., but a series of speeches by Fed and ECB officials will take place. Fed representatives may draw interest, as it remains unclear how the American regulatorUS central bank will act until the end of the year.
On Friday, the euro's recovery may continue. After rebounding from the 1.1666 level, the upward move could extend toward the Kijun-sen line. The trend will start shifting to bullish if the price overcomes the Ichimoku indicator lines and the trendline. For selling opportunities, a rebound from the critical line will be required.


