Veja também

 30.06.2025 06:02 AM
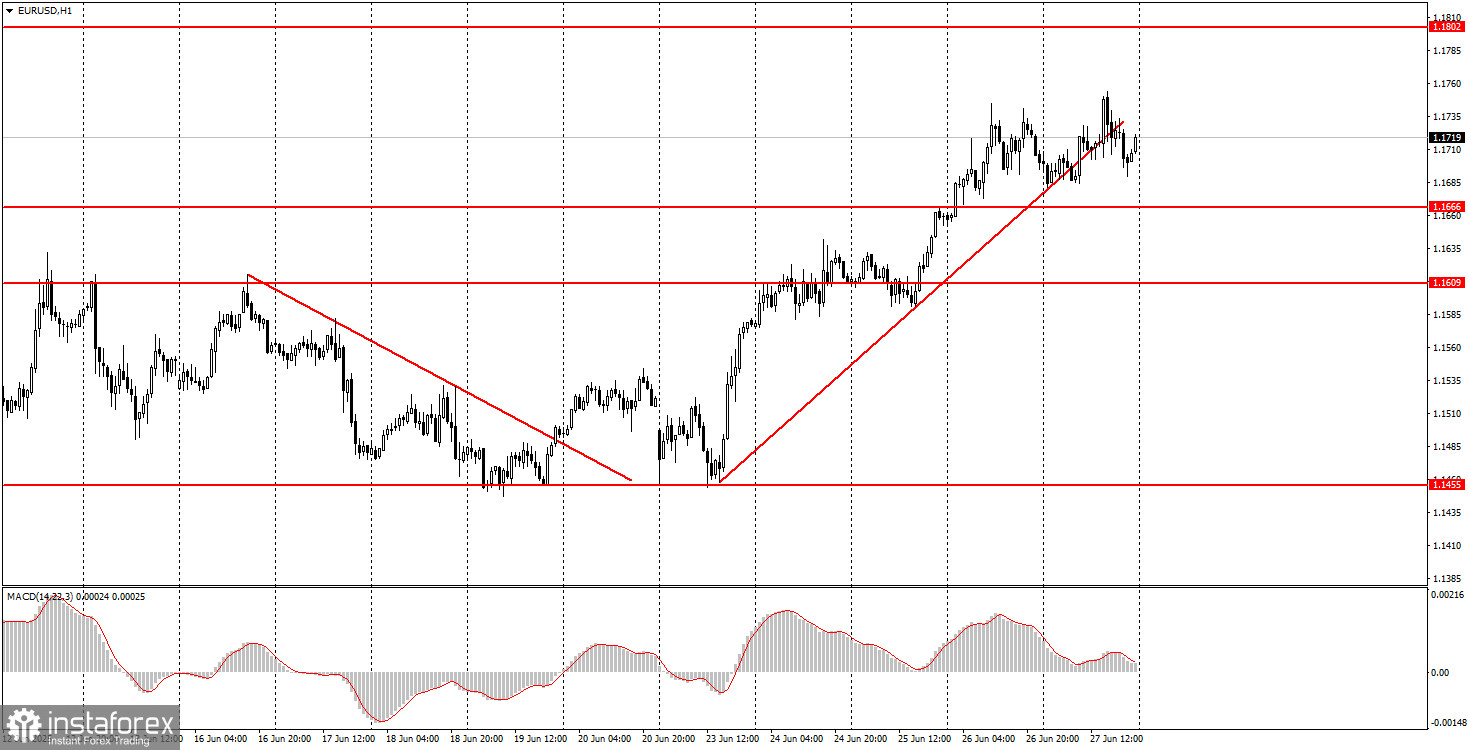
The EUR/USD currency pair showed no significant movements on Friday. For most of the day, the price remained in a sideways range due to a lack of news and macroeconomic releases. Only at the start of the U.S. trading session was there an attempt to break the previous day's highs, but it failed.
It is worth noting that the dollar's new decline may have been triggered by the PCE index, along with reports on personal income and spending by American consumers, which this time showed notable results. For example:
As a result, the dollar came under pressure again, even in the context of secondary macroeconomic data. The dollar still has very few support factors, and the market shows no desire to correct downward. It reaches a new high, consolidates for a while, and then continues to push the pair upward.
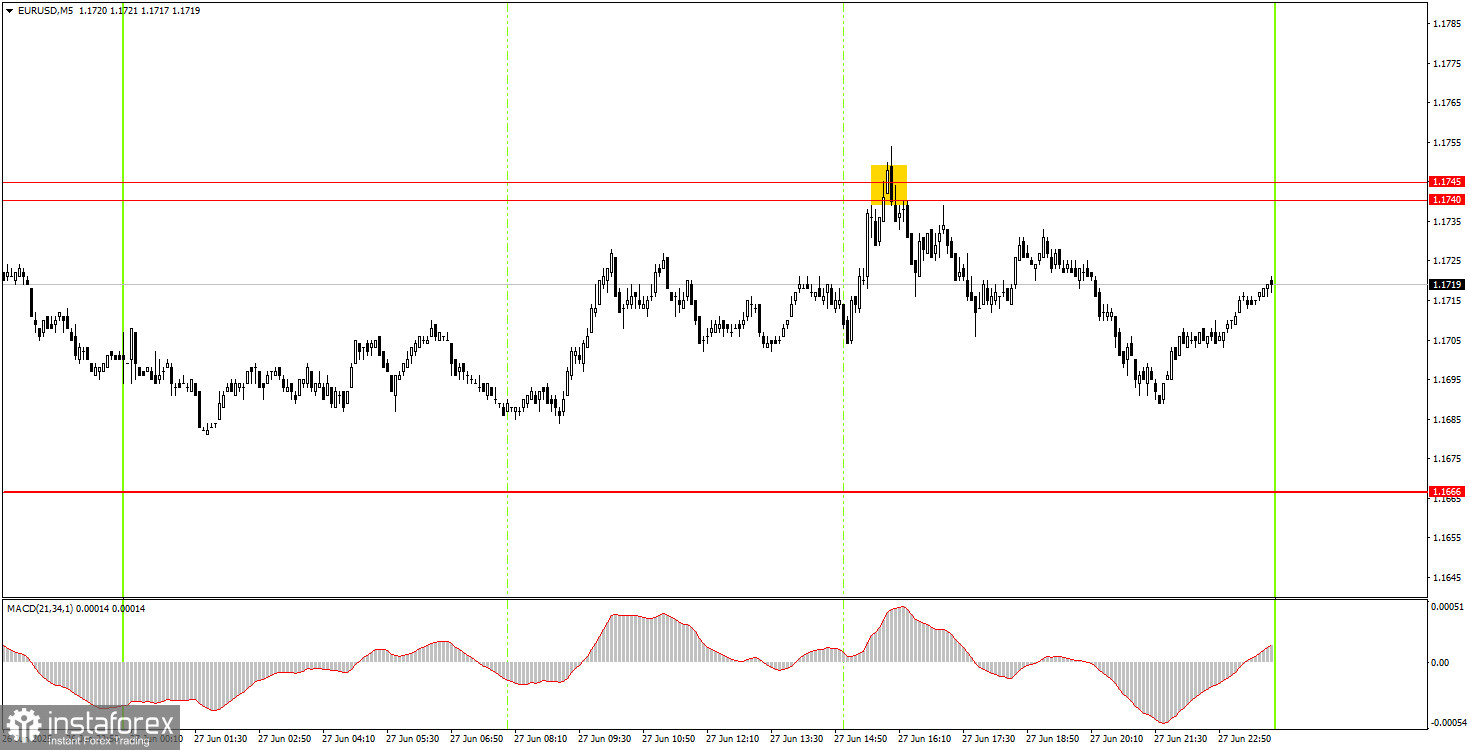
In the 5-minute time frame, only one trading signal formed on Friday. The price failed to break through the 1.1740 level, which by the end of the day turned into a resistance area of 1.1740–1.1745, from which the price rebounded three times last week in total.
It's challenging to determine whether selling was appropriate during such a strong uptrend, but on an intraday level, the price can exhibit pullbacks. In any case, if novice traders decided to act on this signal, they likely ended up with a profit.
In the hourly time frame, the EUR/USD pair continues its uptrend, which began under Donald Trump and is likely to persist under the next president. The fact that Trump is the U.S. president remains sufficient for the dollar to keep falling regularly. Even in the absence of Trump-related news, the dollar cannot hold its ground. The trade war, the decline in the U.S. economy, and the conflict between Trump and the Fed all contribute to eroding confidence in the dollar.
On Monday, EUR/USD may attempt to break through the 1.1740–1.1745 resistance zone again. If not on the first attempt, it's likely to happen on the next.
On the 5-minute chart, pay attention to the following levels: 1.1132–1.1140, 1.1198–1.1218, 1.1267–1.1292, 1.1354–1.1363, 1.1413, 1.1455–1.1474, 1.1527, 1.1561–1.1571, 1.1609, 1.1666, 1.1740–1.1745, 1.1802, 1.1851.
On Monday, among the relatively important events are Germany's retail sales and inflation data, as well as another speech by European Central Bank President Christine Lagarde. These events may slightly affect the intraday movements of the pair.
Support and Resistance Levels: These are target levels for opening or closing positions and can also serve as points for placing Take Profit orders.
Red Lines: Channels or trendlines indicating the current trend and the preferred direction for trading.
MACD Indicator (14,22,3): A histogram and signal line used as a supplementary source of trading signals.
Important Events and Reports: Found in the economic calendar, these can heavily influence price movements. Exercise caution or exit the market during their release to avoid sharp reversals.
Forex trading beginners should remember that not every trade will be profitable. Developing a clear strategy and practicing proper money management are essential for long-term trading success.


