Voir aussi

 20.06.2025 07:16 AM
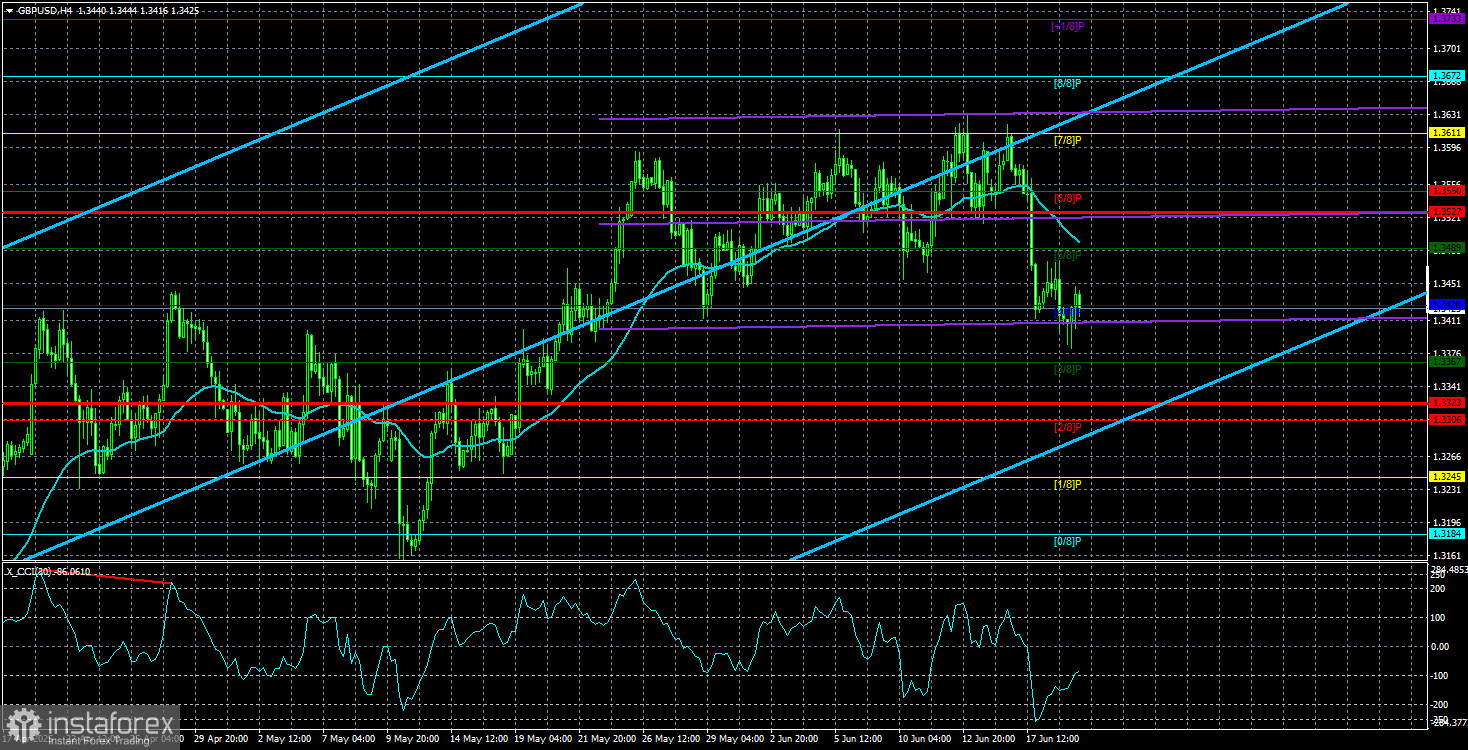
The GBP/USD currency pair traded relatively calmly on Thursday, given the fundamental backdrop available to the market. On Wednesday evening, the Federal Reserve announced the results of its latest meeting, which can be described as "moderately hawkish." However, nothing surprising is found in its hawkish stance, as the U.S. central bank has maintained this position since last year. It's the market—along with Donald Trump—that persistently expects and demands monetary policy easing from the Fed. The objective reality paints a somewhat different picture.
The following day, the Bank of England released its meeting results, which included even less important information. As expected, the key interest rate remained unchanged at 4.25%, and three members of the Monetary Policy Committee voted in favor of a rate cut. It's worth noting that only two votes for a rate cut had been forecast. Thus, the Bank of England's meeting was slightly more dovish than anticipated.
If we set aside all the secondary data from Wednesday and Thursday, here's what remains: The Fed has not and will not lower the rate until Trump finalizes his import tariff decisions. Possibly on July 9 (when the so-called "grace period" ends), we will learn which countries and how exactly will be subject to the White House's levies and duties. Notably, it's not the countries themselves that will be taxed but rather American consumers, who will end up paying more for imported goods. Still, we shouldn't expect any deals with the EU or China before July 9.
Therefore, we seriously doubt anything will change before the next Fed meeting. As for the BoE, its officials had planned four rate cuts this year. Two have already occurred, but inflation jumped to 3.5% a month ago. It remains well above the target level, so we believe the BoE will pause its easing cycle for more than one meeting.
This means neither the Fed nor the BoE intends to ease policy in the near term. As a result, the monetary policy factor will exert equal influence on both the dollar and the pound in the coming months—especially considering their nearly identical key rates. One might assume that under such circumstances, the dollar would stop falling. However, we must emphasize that the main factor influencing the dollar is Trump, not the Fed. Therefore, the future of the dollar depends entirely on Trump. Unfortunately, his actions are utterly unpredictable, making even short-term forecasts—two weeks ahead—irrational. We can only assume that the dollar will continue to depreciate against all its major rivals—sooner or later—unless Trump's policies soften. At the moment, we see no signs of the trade war ending. A deal with the UK is more in Britain's interest than in that of the U.S. or Trump.
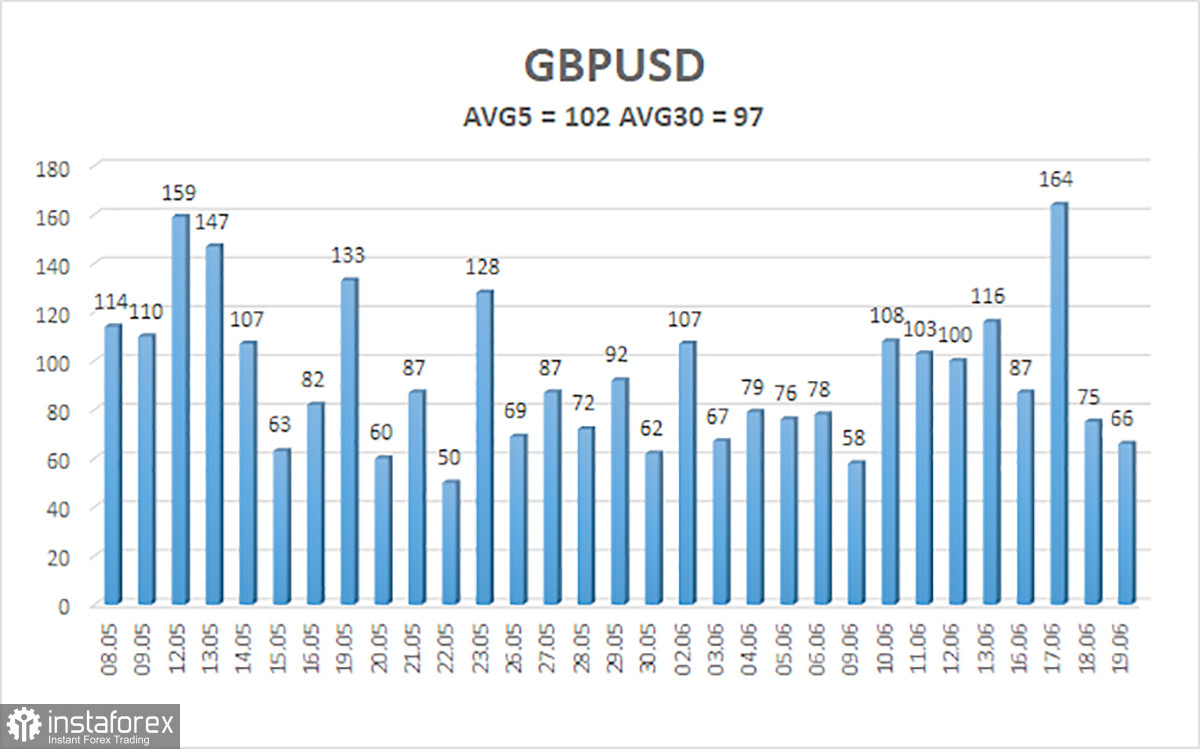
The average volatility of the GBP/USD pair over the last five trading days is 102 pips, which is considered "average" for this pair. On Friday, June 20, we expect movement within the range bounded by the levels of 1.3323 and 1.3527. The long-term regression channel is directed upward, indicating a clear uptrend. This week, the CCI indicator entered oversold territory, which may trigger a renewed upward move.
S1 – 1.3428
S2 – 1.3367
S3 – 1.3306
R1 – 1.3489
R2 – 1.3550
R3 – 1.3611
The GBP/USD currency pair remains in an uptrend, though it is currently undergoing a correction. There is plenty of news supporting this corrective movement. Every new decision by Trump is perceived negatively by the market, while positive news from the U.S. remains scarce. Therefore, long positions targeting 1.3611 and 1.3672 are currently more relevant when the price is above the moving average. If the price consolidates below the moving average, short positions can be considered with targets at 1.3367 and 1.3323. However, the probability of growth is significantly higher than that of a decline. From time to time, the U.S. dollar may show corrective movements, but for a broader rally, it needs clear signs of an end to the global trade war.
Linear Regression Channels help determine the current trend. If both channels are aligned, it indicates a strong trend.
Moving Average Line (settings: 20,0, smoothed) defines the short-term trend and guides the trading direction.
Murray Levels act as target levels for movements and corrections.
Volatility Levels (red lines) represent the likely price range for the pair over the next 24 hours based on current volatility readings.
CCI Indicator: If it enters the oversold region (below -250) or overbought region (above +250), it signals an impending trend reversal in the opposite direction.

