یہ بھی دیکھیں

 11.07.2025 10:10 AM
EUR/USD 5M Analysis
On Thursday, the EUR/USD currency pair continued its sluggish decline, completely ignoring the fundamental backdrop. As a reminder, this week Donald Trump announced new tariffs targeting both long-time partners and specific sectors. Import tariffs were raised for Brazil, South Korea, Japan, and several other countries. However, these measures are set to take effect only from August 1. In essence, this week's events can be summarized as another round of Trump threatening tariff hikes to push trade partners toward concessions.
The same goes for sectoral tariffs—on copper and pharmaceuticals. Trump merely promised to impose a 50% tax on copper imports and 200% on pharmaceuticals. These duties are also expected to take effect from August 1. We believe that the situation could still change multiple times before then—Trump's inconsistency has even been highlighted by Jerome Powell in his statements.
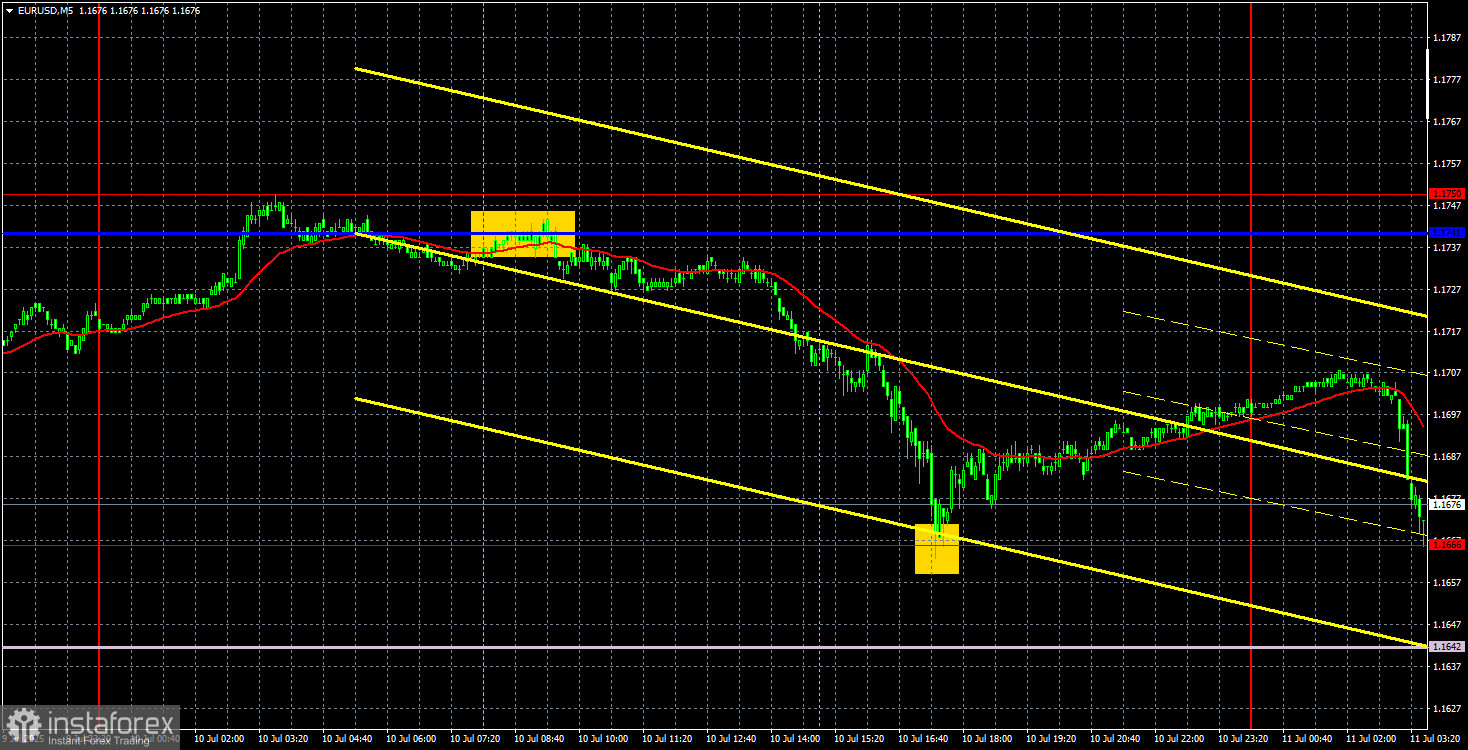
As such, the dollar is currently taking advantage of this temporary opportunity. The most recent key level reached is 1.1666—nearly the "number of the Beast." Of course, we're not superstitious, but the dollar has been strengthening for two weeks in a strictly corrective move, and the overall gain during this time has been a modest 150 points. We believe this "anomaly" is likely to come to an end soon.
On the 5-minute timeframe, two excellent signals were formed yesterday. First, the price bounced perfectly from the Kijun-sen critical line, then it worked through the 1.1666 level and once again rebounded from it with precision. Thus, traders could have opened two trades, at least one of which would have yielded solid profit.
COT Report
The latest COT report is dated July 1. As shown in the chart above, the net position of non-commercial traders has long remained bullish. Bears briefly gained the upper hand at the end of 2024 but quickly lost it. Since Trump took office, the dollar has been in decline. While we cannot say with certainty that the U.S. currency will continue falling, current global developments suggest that outcome.
We still don't see any strong fundamental drivers for euro strength, but there remains one significant factor weighing on the dollar. The long-term downtrend is still intact, but at this point, does it matter what the price has been doing for the past 16 years? The dollar might resume growth once Trump ends his trade wars—but will he, and when?
Currently, the red and blue lines have crossed again, meaning the trend in the market remains bullish. Over the most recent reporting week, the number of long positions held by non-commercial traders increased by 1.2 thousand, while shorts rose by 4.8 thousand. As a result, the net position declined by 3.6 thousand.
EUR/USD 1H Analysis
On the hourly chart, the EUR/USD pair remains in a downward trend, supported by a descending channel. Thus, the dollar may continue to rise erratically for some time, but its fate this time seems sealed. Trump continues to announce new tariffs, trade deals are not being signed, and the dollar's growth remains purely corrective. We believe the current fundamental backdrop still does not support the dollar.
For July 11, we highlight the following levels for trading: 1.1092, 1.1147, 1.1185, 1.1234, 1.1274, 1.1362, 1.1426, 1.1534, 1.1615, 1.1666, 1.1750, and 1.1846–1.1857, as well as the Senkou Span B line (1.1642) and the Kijun-sen line (1.1728). Keep in mind that Ichimoku indicator lines may shift throughout the day, which should be considered when identifying trading signals. Don't forget to place your Stop Loss at breakeven once the price moves 15 points in the right direction—this helps protect against losses if the signal turns out to be false.
For Friday, no major events or publications are scheduled in either the Eurozone or the U.S. We believe there is a high likelihood of another bounce from the 1.1666 level or the Senkou Span B line today. Therefore, traders should be prepared for a potential reversal and the opening of long positions. Since the downtrend remains intact on the 1H chart, an alternative scenario would be to wait for a breakout above the descending channel before considering new long positions. A breakout below 1.1666 should not be viewed as a sell signal, since the strong Senkou Span B line lies just below.
Illustration Key:


