
یہ بھی دیکھیں


 16.07.2026 12:57 AM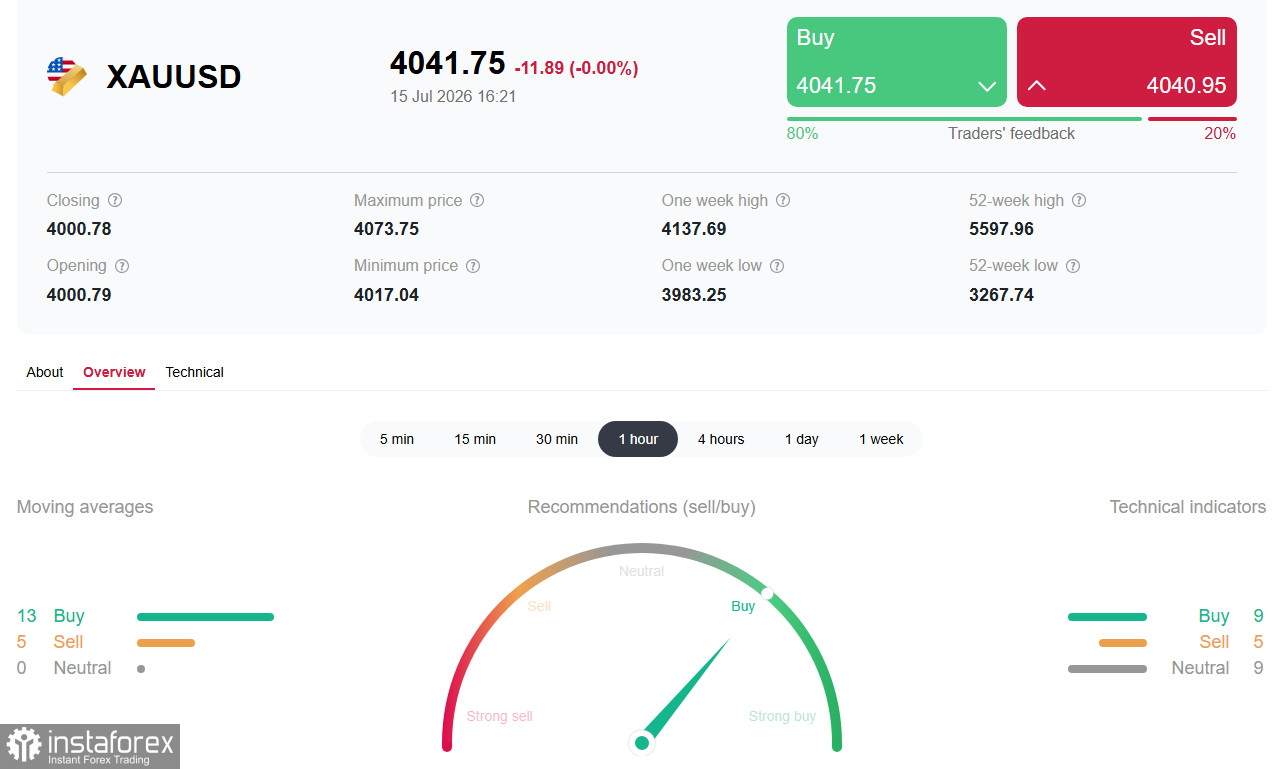
The day's results demonstrate that inflationary risks, fueled by the energy crisis, continue to weigh on the metal, offsetting the positive effect of cooling consumer prices in the U.S.
Wednesday's trading session unfolded with conflicting signals. On Tuesday, the Consumer Price Index (CPI) data for June showed a slowdown in annual inflation to 3.5% from 4.2% in May, while the month-on-month figure decreased by 0.4%, marking the largest drop since April 2020. These figures were perceived as a "dovish" signal, weakening the U.S. dollar and temporarily supporting gold.
However, by mid-Wednesday, optimism faded. The Producer Price Index (PPI) data also came in weaker than forecasts. Nevertheless, the geopolitical factor outweighed the macroeconomic positivity. The escalation of the conflict between the U.S. and Iran, the closure of the Strait of Hormuz, and Brent oil prices rising above $84 per barrel have revived concerns regarding persistent inflation. Markets have begun to factor in the possibility of a Federal Reserve rate hike this year, limiting gold's upside potential.
The Fed maintains a hawkish stance. Fed Chair Kevin Warsh confirmed the central bank's commitment to bringing inflation back to the target level of 2% during his speech in Congress on Tuesday, stating there is "zero tolerance for persistently high inflation." New York Fed President John Williams also noted that the current monetary policy is well-positioned to achieve this goal. Despite weak inflation data, markets maintain about a 60% probability of a rate hike in September.
Geopolitical tensions sustain inflation risks. The resumption of conflict in the Strait of Hormuz and threats to block other strategic routes (such as the Bab-el-Mandeb Strait) continue to support oil prices. This creates a direct inflationary risk, as rising energy costs are passed on to consumer prices.
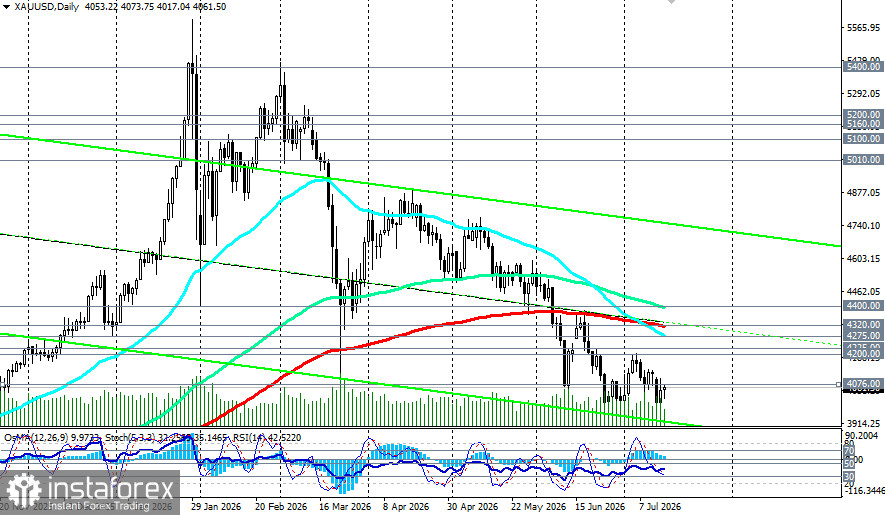
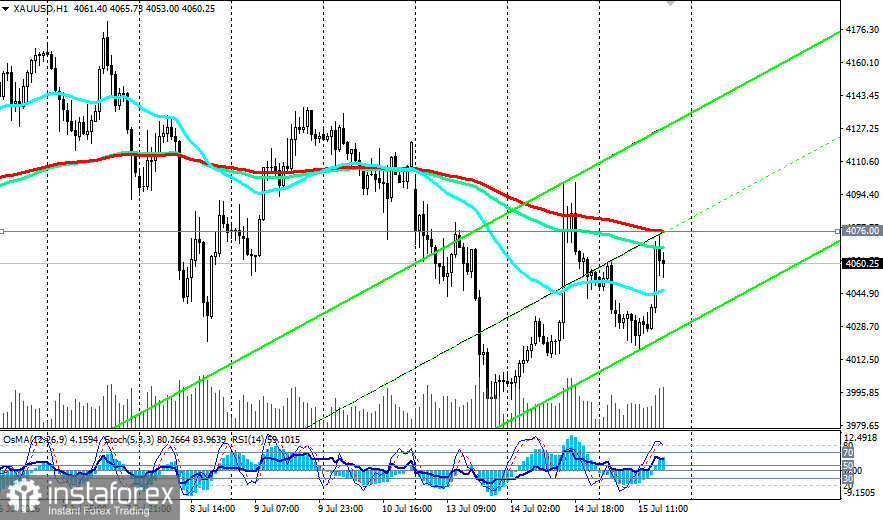
From a technical perspective, XAU/USD maintains a short-term bearish sentiment, consolidating within descending channels on the daily and weekly charts. At the time of writing this overview, the price is in the range of 4055.00–4060.00, which corresponds to a support zone where the price is attempting to find footing after an unsuccessful breakout above 4100.00.
On the daily chart, the price is significantly held below the 50-period EMA (4275.00), the 144-period EMA (4400.00), and the 200-period EMA (4320.00), confirming the persistence of a medium-term bearish trend. The clustering of these long-term moving averages above the spot indicates that attempts at growth are currently limited.
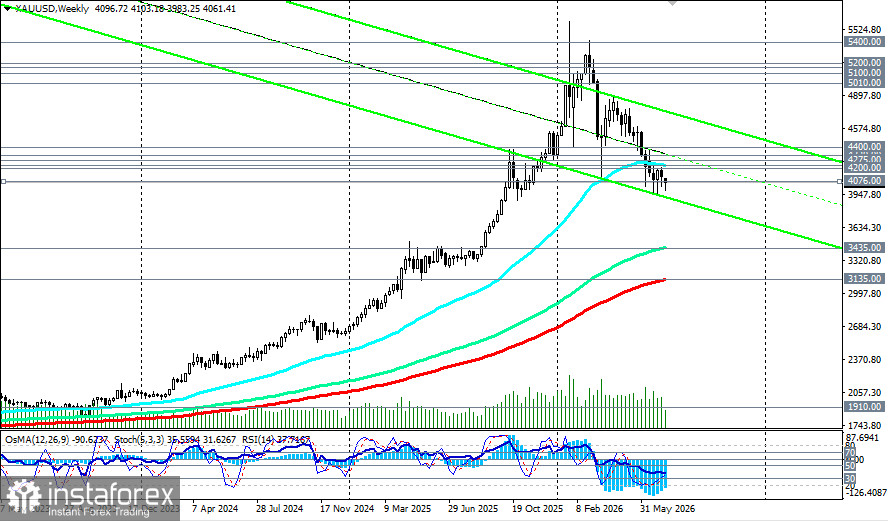
The most likely dynamic is volatile consolidation within the range of 4000.00–4100.00, with a risk of downward breakout in the event of increased geopolitical tension and rising oil prices.
Cautious. The priority is short positions on a breakout below 4000.00. Long positions are advisable only if the price consolidates above 4100.00 and is confirmed by fundamental factors.
Gold ends the day in a state of uncertainty, balancing between the "dovish" impulse from weak U.S. inflation data and the "hawkish" pressure from geopolitical risks and oil price dynamics. The key level of 4000.00 remains the main divide for short-term dynamics. By the end of the week, the market will closely monitor any new signals from the Fed and developments in the Middle East, which will determine the further direction of gold's movement.


