আরও দেখুন


 06.05.2025 06:49 PM
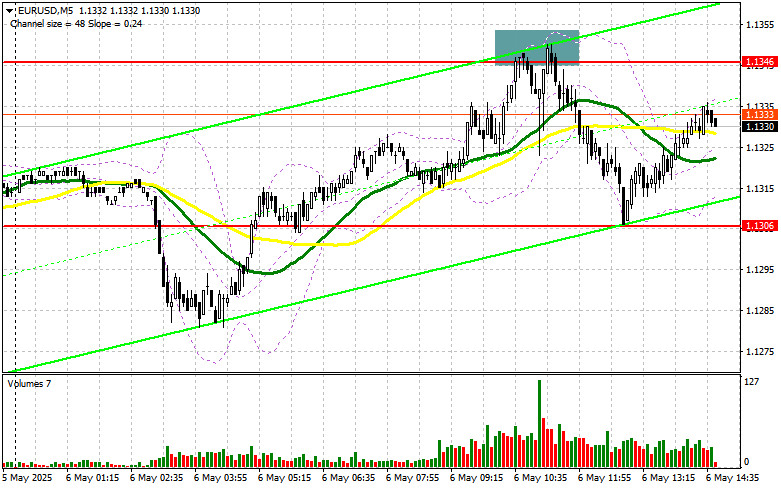
In my morning forecast, I highlighted the 1.1346 level and planned to make trading decisions based on it. Let's take a look at the 5-minute chart and analyze what happened there. The rise and formation of a false breakout around 1.1346 led to an entry point for selling the euro, resulting in a drop of the pair to the level of 1.1306. The technical picture was not revised for the second half of the day.
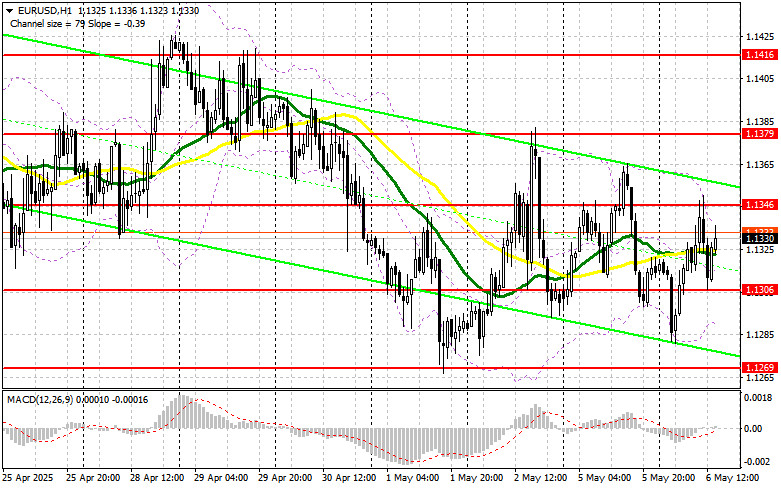
The revised upward PMI services data from eurozone countries led to a slight strengthening of the euro against the dollar in the first half of the day. During the U.S. session, figures on the U.S. trade balance and the RCM/TIPP Economic Optimism Index are expected. If the data is weak, which is more likely, pressure on the dollar will return. In the case of strong data, I would prefer to act on a decline in the 1.1306 support area. A false breakout there, similar to what occurred earlier, will be a reason to buy EUR/USD in anticipation of a market rebound with a return to the 1.1346 level. A breakout and retest of this range will confirm a valid entry point, with the next target at 1.1379. The furthest target will be 1.1416, where I plan to take profit. If EUR/USD declines and shows no activity around 1.1306, pressure on the pair will increase significantly, potentially leading to a stronger downward move. In that case, the bears may push the pair down to 1.1269. I plan to act on long positions only after a false breakout forms there. Immediate long entries will be considered only from 1.1219, targeting an intraday upward correction of 30–35 points.
If the euro rises following U.S. data, bears will again need to prove their presence around 1.1346. Only a false breakout there will serve as a signal to enter short positions with a target at the 1.1306 support area, where the moving averages—currently favoring bulls—are located. A breakout and consolidation below this range will be an appropriate setup for selling, targeting 1.1269. The furthest goal will be 1.1219, where I plan to take profit. Testing this level will break the bullish market structure. If EUR/USD rises again during the second half of the day and bears do not act around 1.1346 (already tested once today), buyers may push for a retest of 1.1379. I will only sell there after a failed consolidation. Short positions on a rebound will be considered from 1.1416, targeting a 30–35 point downward correction.
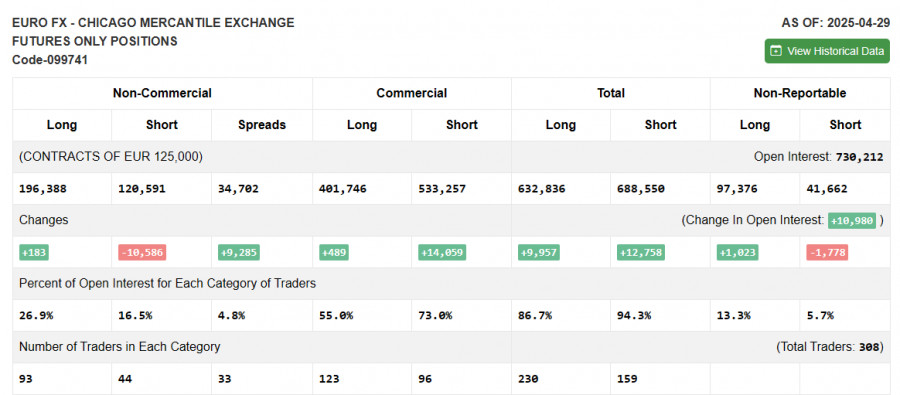
The COT report from April 29 showed a rise in long positions and a decrease in shorts. Considering that the European Central Bank plans to continue lowering interest rates, this fact remains a limiting factor, preventing the euro from returning to a bullish market. Meanwhile, an upcoming Federal Reserve meeting is expected to leave borrowing costs unchanged, which supports the U.S. dollar. According to the COT report, long non-commercial positions increased by 183 to 196,388, while short positions decreased by 10,586 to 120,591. As a result, the gap between long and short positions widened by 9,285.
Moving Averages: Trading is taking place around the 30- and 50-period moving averages, indicating market uncertainty.
Note: The author considers the period and prices of moving averages on the H1 hourly chart, which differs from the standard definition on the D1 daily chart.
Bollinger Bands: In case of a decline, the lower boundary of the indicator around 1.1290 will act as support.
You have already liked this post today
*এখানে পোস্ট করা মার্কেট বিশ্লেষণ আপনার সচেতনতা বৃদ্ধির জন্য প্রদান করা হয়, ট্রেড করার নির্দেশনা প্রদানের জন্য প্রদান করা হয় না।
মঙ্গলবারের ট্রেডের বিশ্লেষণ GBP/USD পেয়ারের 1H চার্ট মঙ্গলবার GBP/USD পেয়ারের সামান্য দরপতন হয়েছে, যা সম্ভবত শুধুমাত্র টেকনিক্যাল কারণেই ঘটেছে। এমনকি ঘণ্টাভিত্তিক টাইমফ্রেমেও স্পষ্টভাবে দেখা যাচ্ছে যে ব্রিটিশ পাউন্ডের মূল্য খুব
মঙ্গলবারের ট্রেডের বিশ্লেষণ EUR/USD পেয়ারের 1H চার্ট মঙ্গলবার নিম্নমুখী প্রবণতার মধ্যেই EUR/USD কারেন্সি পেয়ারের ট্রেডিং চলমান ছিল। ইচ্ছা করলে, মার্কিন ডলারের মূল্যের মাত্র ৫০ পিপসের ঊর্ধ্বমুখী মুভমেন্টের পেছনে সহজেই যুক্তিসঙ্গত
সোমবারের ট্রেডের বিশ্লেষণ GBP/USD পেয়ারের 1H চার্ট সোমবার GBP/USD পেয়ারেরও ঊর্ধ্বমুখী প্রবণতার সাথে ট্রেডিং করা হয়েছে। তবে ব্রিটিশ পাউন্ডের সামগ্রিক টেকনিক্যাল চিত্র ইউরোর তুলনায় কিছুটা আলাদা। হ্যাঁ, পাউন্ডের মূল্যও ইউরোর
সোমবারের ট্রেডের বিশ্লেষণ EUR/USD পেয়ারের 1H চার্ট সোমবার ঊর্ধ্বমুখী প্রবণতার সাথে EUR/USD কারেন্সি পেয়ারের ট্রেড করা হয়েছে। আমরা পূর্বেই সতর্ক করেছিলাম যে ডোনাল্ড ট্রাম্প কর্তৃক স্টিল ও অ্যালুমিনিয়াম আমদানির
শুক্রবারের ট্রেডের বিশ্লেষণ GBP/USD পেয়ারের 1H চার্ট শুক্রবার পুরো দিনজুড়েই তুলনামূলক স্থিতিশীলভাবে GBP/USD পেয়ারের ট্রেডিং পরিলক্ষিত হয়েছে। সেদিন কোনো গুরুত্বপূর্ণ খবর বা ইভেন্ট ছিল না, ফলে এই পেয়ারের মূল্যের অস্থিরতার
শুক্রবারের ট্রেডের বিশ্লেষণ EUR/USD পেয়ারের 1H চার্ট বৃহস্পতিবারের তুলনায় শুক্রবার অনেকটাই স্থিতিশীলভাবে EUR/USD কারেন্সি পেয়ারের ট্রেডিং পরিলক্ষিত হয়েছে। এটি মোটেও অপ্রত্যাশিত পরিস্থিতি ছিল না, কারণ সামষ্টিক অর্থনৈতিক প্রেক্ষাপটের প্রভাব দুর্বল
বৃহস্পতিবারের ট্রেডের বিশ্লেষণ GBP/USD পেয়ারের 1H চার্ট বৃহস্পতিবার EUR/USD পেয়ারের মতোই GBP/USD পেয়ারের মূল্যের মুভমেন্ট দেখা গেছে, তবে তুলনামূলকভাবে অস্থিরতার মাত্রা কম ছিল। এই পেয়ারের মূল্য অ্যাসেন্ডিং ট্রেন্ডলাইনটি ব্রেক করেছে
বৃহস্পতিবারের ট্রেডের বিশ্লেষণ EUR/USD পেয়ারের 1H চার্ট বৃহস্পতিবার দিনের শুরুতে EUR/USD কারেন্সি পেয়ার তীব্র দরপতনের শিকার হয়, তবে দিনের বাকি সময়টিতে শক্তিশালী ঊর্ধ্বমুখী প্রবণতার সাথে ট্রেড করা হয়েছে। বৃহস্পতিবার
বৃহস্পতিবার EUR/USD পেয়ারের তুলনায় GBP/USD কারেন্সি পেয়ারের মূল্যের অপেক্ষাকৃত স্বল্প মাত্রার অস্থিরতা দেখা গেছে, যা কিছুটা বিস্ময়কর। একই সময়ে, ব্রিটিশ পাউন্ডের মূল্য খুব বেশি ঝামেলা ছাড়াই ক্রিটিক্যাল লাইনের দিকে ফিরে
বৃহস্পতিবার রাতের দিকে EUR/USD পেয়ার তীব্র দরপতনের শিকার হয়, তবে দিনের বাকি সময়জুড়ে এই পেয়ারের মূল্য তিনগুণ বেশি শক্তিশালীভাবে ঊর্ধ্বমুখী রিবাউন্ড করে। রাতের বেলা এই পেয়ারের মূল্যের এই দিক পরিবর্তনের
 Our new app for your convenient and fast verification
Training video

Your IP address shows that you are currently located in the USA. If you are a resident of the United States, you are prohibited from using the services of InstaFintech Group including online trading, online transfers, deposit/withdrawal of funds, etc.
If you think you are seeing this message by mistake and your location is not the US, kindly proceed to the website. Otherwise, you must leave the website in order to comply with government restrictions.
Why does your IP address show your location as the USA?
Please confirm whether you are a US resident or not by clicking the relevant button below. If you choose the wrong option, being a US resident, you will not be able to open an account with InstaTrade anyway.
We are sorry for any inconvenience caused by this message.


