یہ بھی دیکھیں

 17.07.2025 12:45 AM
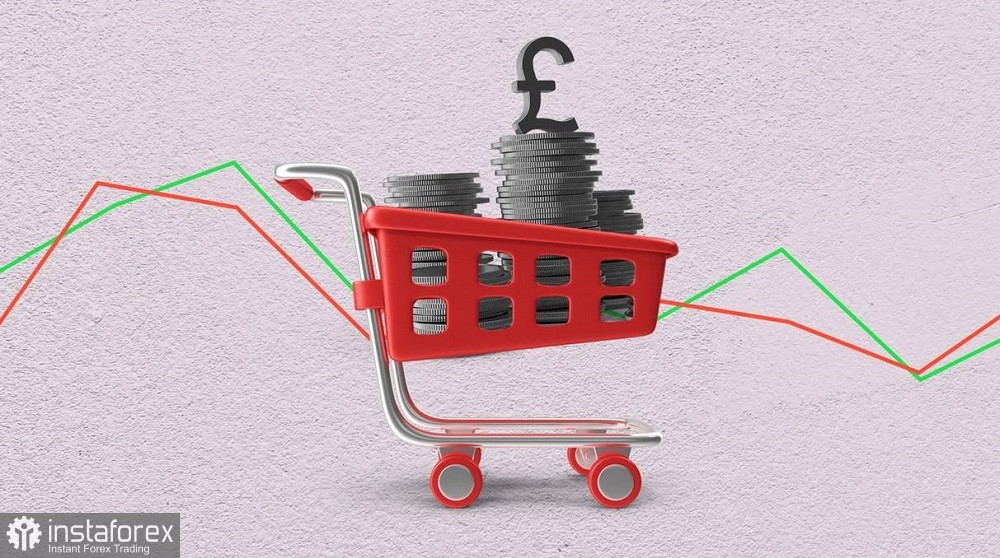
The pound reacted negatively to Wednesday's UK inflation report. Despite all components of the release coming in the "green zone," GBP/USD rose by just 30 points before returning to the 1.33 area. This reaction shows that the greenback is still in control, although it struggles to find direction amid conflicting fundamental signals (US CPI accelerated, while PPI slowed). In this context, the "positive" inflation print from the UK works against the pound. After all, the combination of a shrinking economy, a cooling labor market, and accelerating inflation points to stagflation. Such a troubling mix is inherently unfavorable for the growth of GBP/USD.
According to the data, the UK's headline Consumer Price Index accelerated to 0.3% m/m (vs. forecast of +0.2%) and to 3.6% y/y (vs. forecast of 3.4%)—the fastest pace of growth since January 2024. Core CPI (excluding energy and food) also rose more than expected: up to 3.7% vs. the forecast of 3.5%.
The Retail Price Index (RPI)—used in wage negotiations—climbed to 4.4% y/y vs. expectations for a drop to 4.2%. On a monthly basis, RPI rose by 0.4% vs. a forecast of 0.2%.
The report's breakdown shows that transportation costs rose by 9% in June, airfare jumped by 7.9% (the highest June increase in this category since 2018), and food prices grew by 4.5%, driven by rising prices of beef, butter, and chocolate. Housing costs rose by 3.9%, with rents climbing nearly 7%.
It's essential to note that many of the factors driving the inflation rise appear to be structural, rather than temporary. Core inflation in services (including rent, insurance, healthcare, and education) stands at 4.7%, significantly above the headline CPI. Rising rent and housing prices suggest supply-side structural issues, rather than seasonal volatility. Meanwhile, private sector wages continue to increase at a robust pace, fueling secondary inflation effects as companies pass costs on to consumers. Notably, food inflation has remained above 4.5% for several months now.
All of this suggests that inflationary pressure in the UK is persistent, not transitory.
At the same time, UK GDP is contracting for the second straight month: the economy shrank by 0.1% m/m in May and by 0.3% in the previous month. Other components are also weak. For example, industrial production declined by 0.9% month-over-month (m/m) and by 0.3% year-over-year (y/y), while manufacturing output dropped by 1.0% m/m (vs. a forecast of -0.1%).
As we can see, all signs of stagflation are present. More recent labor market data will be released on Thursday (July 17), but based on previous dynamics and forecasts, it is unlikely to offer any relief. The most recent report showed that unemployment in the UK rose to 4.6%, the highest level since July 2021, while the number of jobless claims hit an almost yearly high (+33,000). Preliminary forecasts suggest that in June, claims will rise by another 18,000, and unemployment (as of May) could climb to 4.7%.
If the report meets forecasts—or worse, enters "red zone" territory—it would confirm the labor market is cooling. That would add additional pressure on the pound, reinforcing the stagflation narrative.
So why isn't GBP/USD plummeting, given this gloomy outlook for the pound? Because the US PPI report came to the rescue of GBP/USD buyers. Unlike CPI, this inflation indicator landed in the "red zone," reflecting a slowdown in core components. Specifically, headline PPI fell to 2.3% y/y in June from 2.6% the month before. Core PPI also slowed to 2.6% y/y vs. the forecast of 2.7%—this marks the fifth consecutive month of core PPI declines.
In response, the US dollar index retreated from its highs, allowing GBP/USD to recover from its intraday lows.
Still, in my view, the "ghost of stagflation" will continue to haunt the British currency, making long positions in GBP/USD risky, even amid dollar weakness. However, for the downtrend to be confirmed, GBP/USD sellers need to push the pair below the lower Bollinger Band on the H4 chart (1.3350). A break of that level would open the way toward the primary bearish target at 1.3280 (the middle Bollinger Band on the D1 timeframe).


