Vea también

 22.09.2025 11:45 AM
On Friday, the EUR/USD pair continued its decline after bouncing off the 1.1789–1.1802 zone. The decline in the euro may continue toward the 76.4% corrective level at 1.1695, but I believe that the euro's fall is a coincidence. I'll explain why below. A rebound from the 1.1695 level will work in favor of the euro and the restoration of the "bullish" trend. A consolidation above the resistance zone of 1.1789–1.1802 will increase the probability of continued growth toward 1.1896.
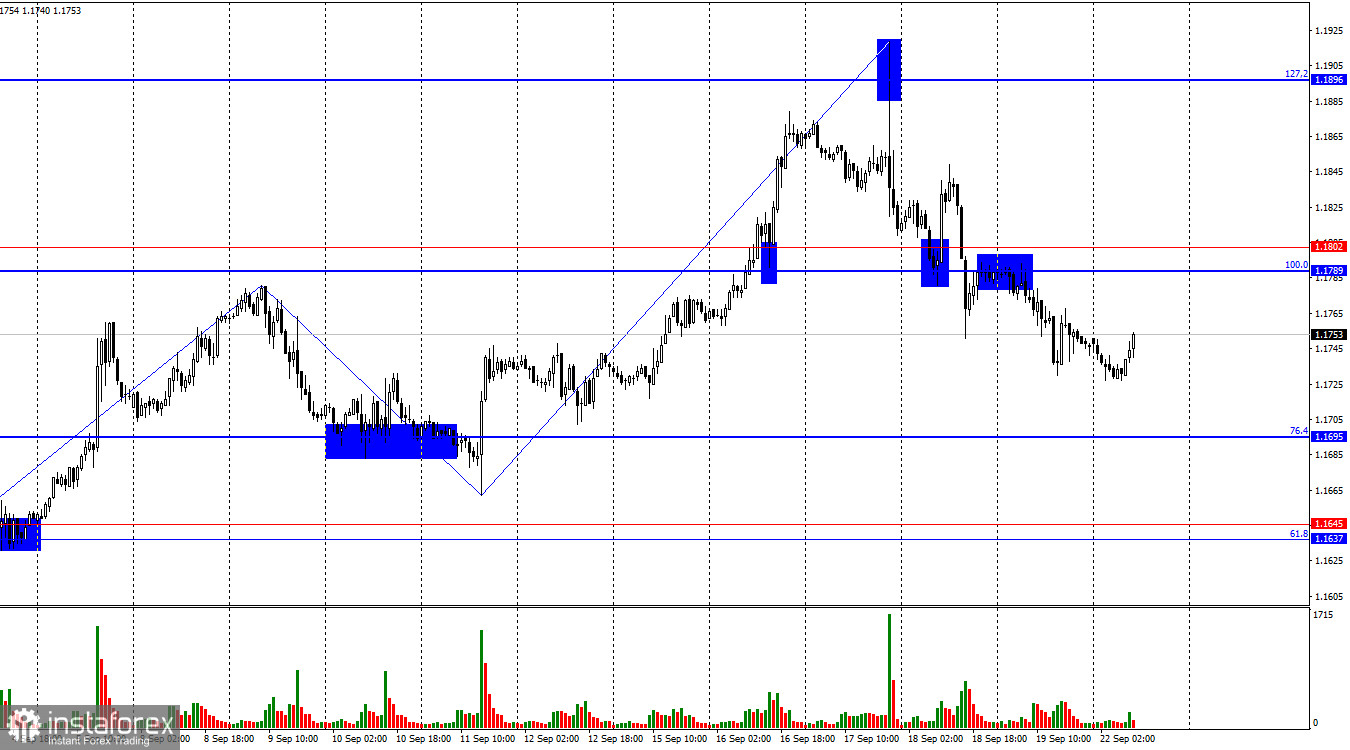
The wave situation on the hourly chart remains simple and clear. The last completed upward wave broke the peak of the previous one, and the last downward wave did not break the previous low. Thus, the trend is still "bullish" at this time. Recent labor market data and the changed outlook for the Federal Reserve's monetary policy currently support only the bulls, while the bears remain sidelined. For the trend to change to "bearish," the pair would need to fall to the support zone of 1.1637–1.1645.
Despite the lack of significant news, bears continued to push the market. In my opinion, the euro's decline was not fundamentally justified. Last week, the FOMC (Federal Open Market Committee) decided to cut the interest rate and hinted at the possibility of doing so again during the year's remaining two meetings. What more dovish scenario could have been expected? The week before that, the ECB clearly stated that no further monetary easing was needed — another point in favor of the euro. U.S. economic data in recent weeks has been weak, which further weighs on the dollar. Therefore, I consider the recent EUR/USD decline a coincidence or merely a technical correction. While there were factors influencing the drop, they were mostly related to the British pound, not issues in France or the Fed's supposedly "not dovish enough" stance. I currently see no reason to abandon the bullish trend.
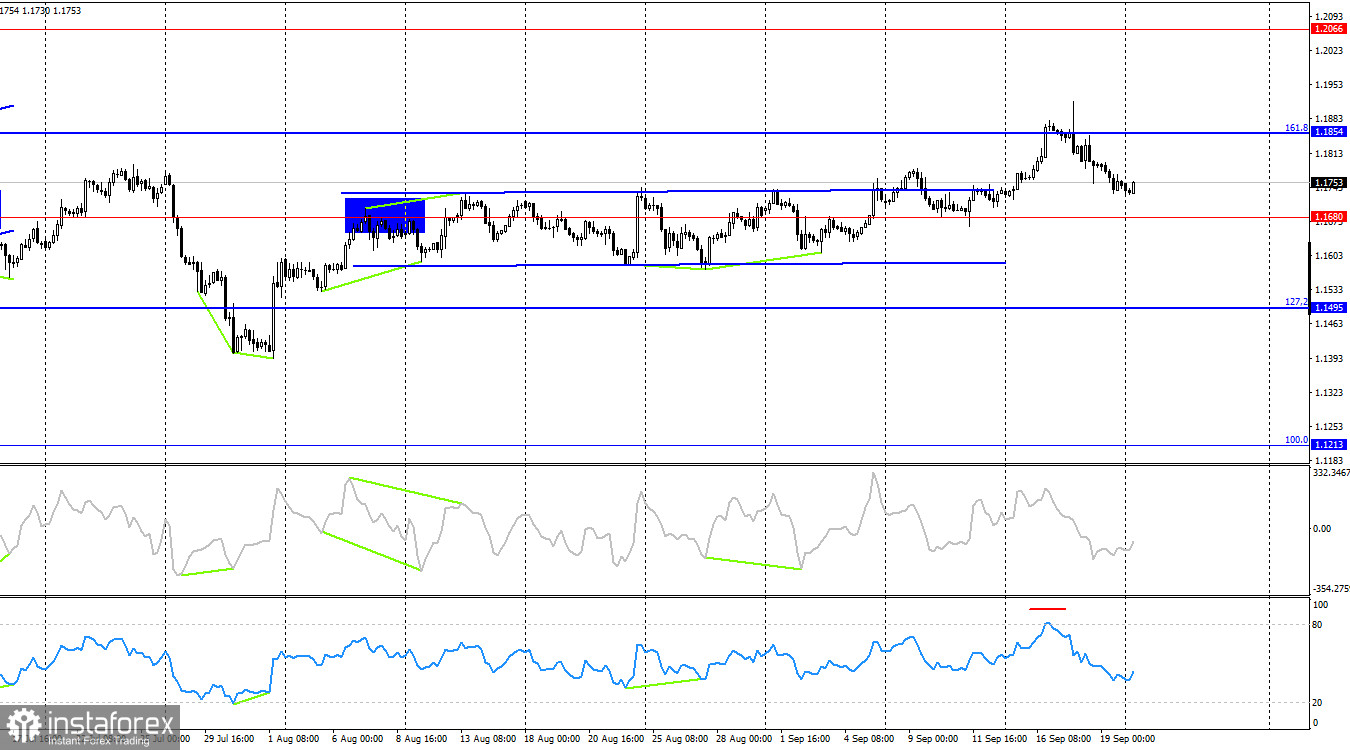
On the 4-hour chart, the pair consolidated above the horizontal channel, allowing traders to expect further growth. A rebound from the 161.8% Fibonacci level at 1.1854 worked in favor of the U.S. dollar and led to a minor pullback toward 1.1680. A consolidation above the 1.1854 level would allow traders to anticipate continued growth toward the 1.2066 level. No emerging divergences are currently visible on any indicator.
Commitments of Traders (COT) Report:
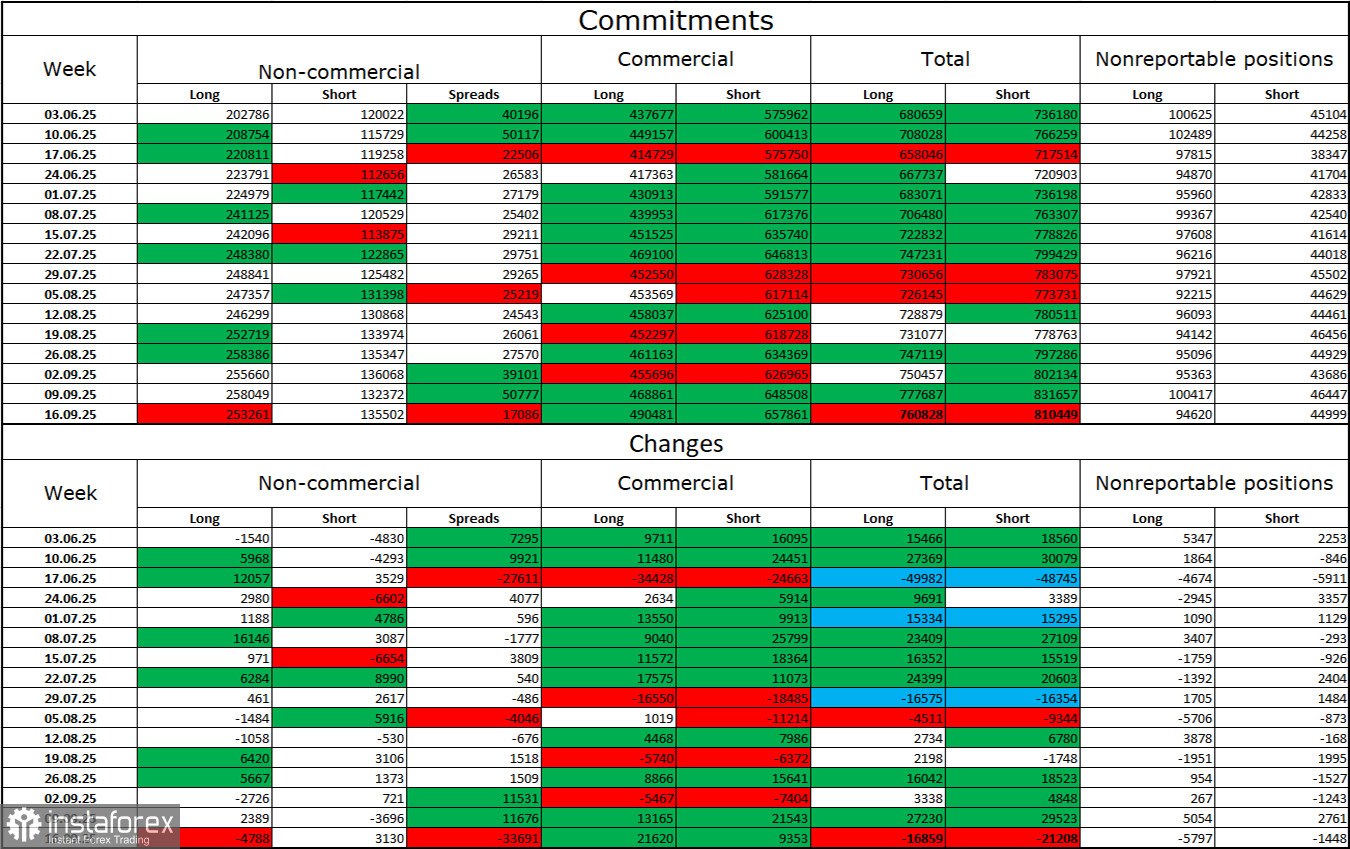
Over the past reporting week, professional market participants closed 4,788 Long positions and opened 3,130 Short positions. The sentiment of the "Non-commercial" trader group remains bullish, thanks in part to Donald Trump, and continues to strengthen. The total number of Long positions held by speculators now stands at 253,000, versus 135,000 Short positions — nearly a 2:1 ratio in favor of the bulls. Also, note the number of green cells in the table above — a sign of strong accumulation of long positions in the euro. More often than not, interest in the euro is growing while interest in the dollar is falling.
For 32 consecutive weeks, major players have been reducing Short positions and increasing Longs. Donald Trump's policies continue to be a significant factor for traders as they may trigger long-term structural problems for the U.S. economy. Despite the signing of several key trade agreements, many important economic indicators in the U.S. are showing a decline.
Economic Calendar for the U.S. and Eurozone:September 22 contains no noteworthy economic events. The news background will have no influence on market sentiment on Monday.
EUR/USD Forecast and Trader Recommendations:
Selling the pair was possible on a rebound from the 1.1896 level on the hourly chart with a target at 1.1802 – target reached. New short opportunities were also available on a close below the 1.1789–1.1802 zone with a target at 1.1695 – these trades can still be held open until a buy signal appears, with Stop Loss set to breakeven. Buying opportunities may develop today if the price closes above the 1.1789–1.1802 zone (target: 1.1896) or on a rebound from the 1.1695 level.
Fibonacci levels are plotted from 1.1789–1.1392 on the hourly chart and from 1.1214–1.0179 on the 4-hour chart.


